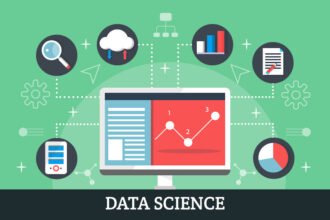
 Data analysts are tasked with a search for understanding from increasingly large data sets. Within the field, analysts and data scientists use a variety of tools to extract value and meaning from structured, and more recently even unstructured data.
 Data analysts are tasked with a search for understanding from increasingly large data sets. Within the field, analysts and data scientists use a variety of tools to extract value and meaning from structured, and more recently even unstructured data. Each new technology represents an incremental improvement in the way that people collect, analyze, visualize, and report our data, making the data discovery process faster and more accessible than ever.
Visualization tools in particular are a critical component as the scale of data continues to grow. The complexity of modern data makes larger data sets incomprehensible, and visualization tools provide an interactive metaphor as users section and explore data. These tools, combined with the ability to look across disparate data sets, give analysts the ability to connect seemingly unrelated data and discover patterns that would previously have taken months of work to uncover or might never have been revealed at all. Humans need these pictures as a bridge between typical rows and columns style text and the enormous data sets that are being created today.
Combined with machine learning solutions and significant hardware resources, the most advanced technologies are making news for their ability to help guide researchers to impressive outcomes. These pioneering technologies tout medical advances, critical advances in law enforcement, and innovative research in diverse and interesting fields. For more everyday business applications, these tools can help users discover new sources of revenue or identify costly errors.
Still, these tools rely on a few particularly talented individuals to wrestle valuable information from large and complex data sets. With even the most advanced visualization and business intelligence tools, the user is the driving force in data discovery. In writing queries or exploring data sets with visualization tools, discovery remains a manual process and is subject to the direction of the user. The analysts’ skill set and knowledge of the data will have a large and direct impact on the quality and accuracy of the results and the time to answer. In effect, the process of detection is aided, but not automated.
The automated discovery process leads analysts to answers in a matter of minutes. Automated pattern detection provides users with a ranked list of the most relevant, surprising, and impactful patterns in data.
Automating the analysis stage is a concept that elicits a knee-jerk fear reaction from many data scientists. Questions arise regarding the processes, the technology, and the results. In nearly every case, graph analytics solutions won’t replace analysts, but will exist as an additional tool that will speed up the time-to-answer process. Automated analysis will lead data scientists to faster results and more creative solutions.
Just imagine–what if your data analysts could reach the stage of insight in minutes or hours instead of weeks or months? Not only would the company save time and money, but analysts would save themselves from the tedium of manual analysis and modeling to become more involved in business insights, implementation, and data-driven solutions.
Large, complicated, and varied data sets are filled with potentially profound value. If only data scientists’ hours were spent doing less manual querying and modeling and more synthesis of insight based on patterns that could be automatically discovered, the speed of action could make data scientists’ skills something that presents dramatic return-on-investment. Automated analysis could mean a growth in hiring of data scientists who are trained analytical thinkers, but who might not have any background in coding–much like the article mentioned above.
Automated analysis does not mean an end to the job of the data scientist. If anything, it means a renaissance of analytics as a highly valuable business tool, the chance for data scientists to think more in the theoretical world of data synthesis as a tool for solution development, and a way to enable more people to reach data-critical decisions faster and more accurately than at any other point in history.


