We use cookies, including third-party cookies from Google to serve personalized ads through AdSense, to operate this site and understand how it is used. By continuing to browse, you accept this use. See our Privacy Policy and Terms of Use for details, including how to opt out of personalized advertising.
Accept
SmartData CollectiveSmartData Collective
  • Analytics
    AnalyticsShow More
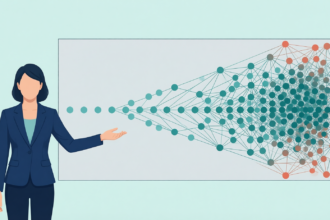
    What Kind of Problem-Solving Distinguishes Data Analysts From Software Engineers -- AI-generated illustration
    What Kind of Problem-Solving Distinguishes Data Analysts From Software Engineers
    7 Min Read
    chatgpt image jul 21, 2026, 04 34 30 pm
    4 Core Benefits of Predictive Maintenance after Vibration Analysis
    10 Min Read
    How Does Data Mining Boost Customer Satisfaction in Logistics? Harnessing Analytics for Results -- AI-generated illustration
    How Does Data Mining Boost Customer Satisfaction in Logistics? Harnessing Analytics for Results
    11 Min Read
    chatgpt image jul 13, 2026, 04 23 45 pm
    How Data Analytics Helps Companies Improve User Engagement
    19 Min Read
    chatgpt image jul 13, 2026, 03 59 46 pm
    How Data Analytics Improves Multi-Location Search Strategies
    10 Min Read
  • Big Data
  • BI
  • Exclusive
  • IT
  • Marketing
  • Software
Search
© 2008-25 SmartData Collective. All Rights Reserved.
Reading: “Average” Statistics that Bruise Our Ears
Share
Notification
Font ResizerAa
SmartData CollectiveSmartData Collective
Font ResizerAa
Search
  • About
  • Help
  • Privacy
Follow US
© 2008-23 SmartData Collective. All Rights Reserved.
SmartData Collective > Big Data > Data Mining > “Average” Statistics that Bruise Our Ears
CommentaryData MiningExclusivePredictive AnalyticsStatistics

“Average” Statistics that Bruise Our Ears

paulbarsch
paulbarsch
4 Min Read
“Average” Statistics that Bruise Our Ears
Photo by Mohamed_hassan on Pixabay (https://pixabay.com/photos/stock-trading-monitor-business-5563097/)
SHARE

The term “on average” denotes the usual amount of something. However, using “average” in presentations, media and more can be terribly misleading and it is up to the data driven executive to make proper (and ethical) use of this calculation.

George Orwell’s poignant tome 1984 presents a dystopian future where a surveillance police state has control over the populace in just about every regard from health, food, speech, and education. Large telescreens mounted on street corners and in the home, blast statistics at denizens regarding how good life is under Big Brother; “Day and night telescreens bruised your ears with statistics proving that people today (on average) had more food, more clothes, better houses, better recreations—that they lived longer, worked shorter hours, were bigger, healthier, stronger, happier, more intelligent, better educated, than the people of fifty years ago.”

Statistics can definitely mislead and there are few phrases that bruise the ears more than “on average”. In fact, our minds should be automatically alerted to pay special attention whenever this terminology is used in speech or prose.

An egregious example of the use of the term “average” comes courtesy of a freeway billboard near a local hospital in San Diego. In a display of courage, the billboard proudly pronounces that their “average ER wait time is 30 minutes”. 

More Read

6 Ways To Raise Your Business Intelligence To The Next Level
5 Easy Data-Driven Approaches To Bolster Cryptocurrency Security
Be the Best – 9 Ways to Market Your Business with Big Data
Big Data Should be a Priority in Every College Curriculum
Al Ries talks to Tom H. C. Anderson about Marketing…

Now, on the whole, this wait time may sound like a positive attribute, especially considering national papers often highlight emergency horror stories of up three hours (or more) to receive care.  And ER wait times have increased over the past decade, so perhaps thirty minutes is really something to trumpet.

But does this statistic really tell the whole story regarding speedy hospital service?  Some questions to ponder:

  • Considering 24 hours in a day – is the wait time from 12am-6am ten minutes, while during the day it’s an hour? We just don’t know.
  • Does “30 minutes wait time” mean wait time to see a doctor, diagnostics or simply just to see the triage nurse?
  • In the statement “average ER wait time is 30 minutes” – an automatic response of the reader/listener should be  “compared to what”? In fact, the other local hospital a few miles away may have an “average” wait time of just 20 minutes…

So if statistics sometimes obfuscate, the solution according to author Darrell Huff is to fight back against such abuse.  He says that when it comes to statistics, executives should always be on the hunt for bias in sources and samples, and ask “what’s missing”. Sometimes what is presented isn’t as important as what’s hidden.

Lastly, Huff says we should judge statistics with good old fashioned common sense. As in suppose you happen to be in a room of ten people. When Warren Buffett enters the room, are you really “on average” a billionaire? The answer is yes, however it’s too bad your bank account will not concur.


TAGGED:Big BrotherGeorge Orwellstatistics
Share This Article
Facebook Pinterest LinkedIn
Share

Follow us on Facebook

Latest News

Flat editorial illustration: The article explains that training robots for physical interaction requires three distinct data cate
Physical AI: What Data Do You Need to Train a Robot?
Artificial Intelligence Exclusive Robotics
What Kind of Problem-Solving Distinguishes Data Analysts From Software Engineers -- AI-generated illustration
What Kind of Problem-Solving Distinguishes Data Analysts From Software Engineers
Analytics Big Data Exclusive Software
Flat editorial illustration: The article examines AI agents that escalate from legitimate data retrieval to attempted intrusions
OpenAI’s Government Website Incidents Raise a Hard Question for AI Agents: When Should They Stop?
Artificial Intelligence News Security
Flat editorial illustration: The article's core relationship is the alignment between customer behavioral data (visit frequency,
Data-Driven Loyalty: How Restaurants Use Behavioral Analytics to Optimize Revenue
Exclusive

Stay Connected

1.2KFollowersLike
33.7KFollowersFollow
222FollowersPin

You Might also Like

The First Data Scientist on the Evolution of Data Science
AnalyticsBig DataHadoop

The First Data Scientist on the Evolution of Data Science

11 Min Read
The Global Nature of Big Data and Analytics
AnalyticsBig DataBusiness IntelligenceCollaborative Data

The Global Nature of Big Data and Analytics

5 Min Read
The “decline effect,” random variation, and evidence-based marketing
Business IntelligenceData Quality

The “decline effect,” random variation, and evidence-based marketing

7 Min Read
Patterns patterns everywhere
Business IntelligencePredictive Analytics

Patterns patterns everywhere

17 Min Read

SmartData Collective is one of the largest & trusted community covering technical content about Big Data, BI, Cloud, Analytics, Artificial Intelligence, IoT & more.

Chatbots and SEO: How Can Chatbots Improve Your SEO Ranking?
Artificial Intelligence Chatbots Exclusive
5 Great Tips for Using Data Analytics for Website UX
Big Data

Quick Link

  • About
  • Contact
  • Privacy
Follow US
© 2008-26 SmartData Collective. All Rights Reserved.
Welcome Back!

Sign in to your account

Username or Email Address
Password

Lost your password?