

Business leaders often talk about uncertainty as if it arrives without warning. Market shifts, cash flow strain, and demand swings can feel sudden, yet most financial disruptions leave signals long before they hit. Data analytics offers a way to interpret those signals and translate them into a financial weather map that helps organizations prepare instead of react.
What a Financial Weather Map Really Means
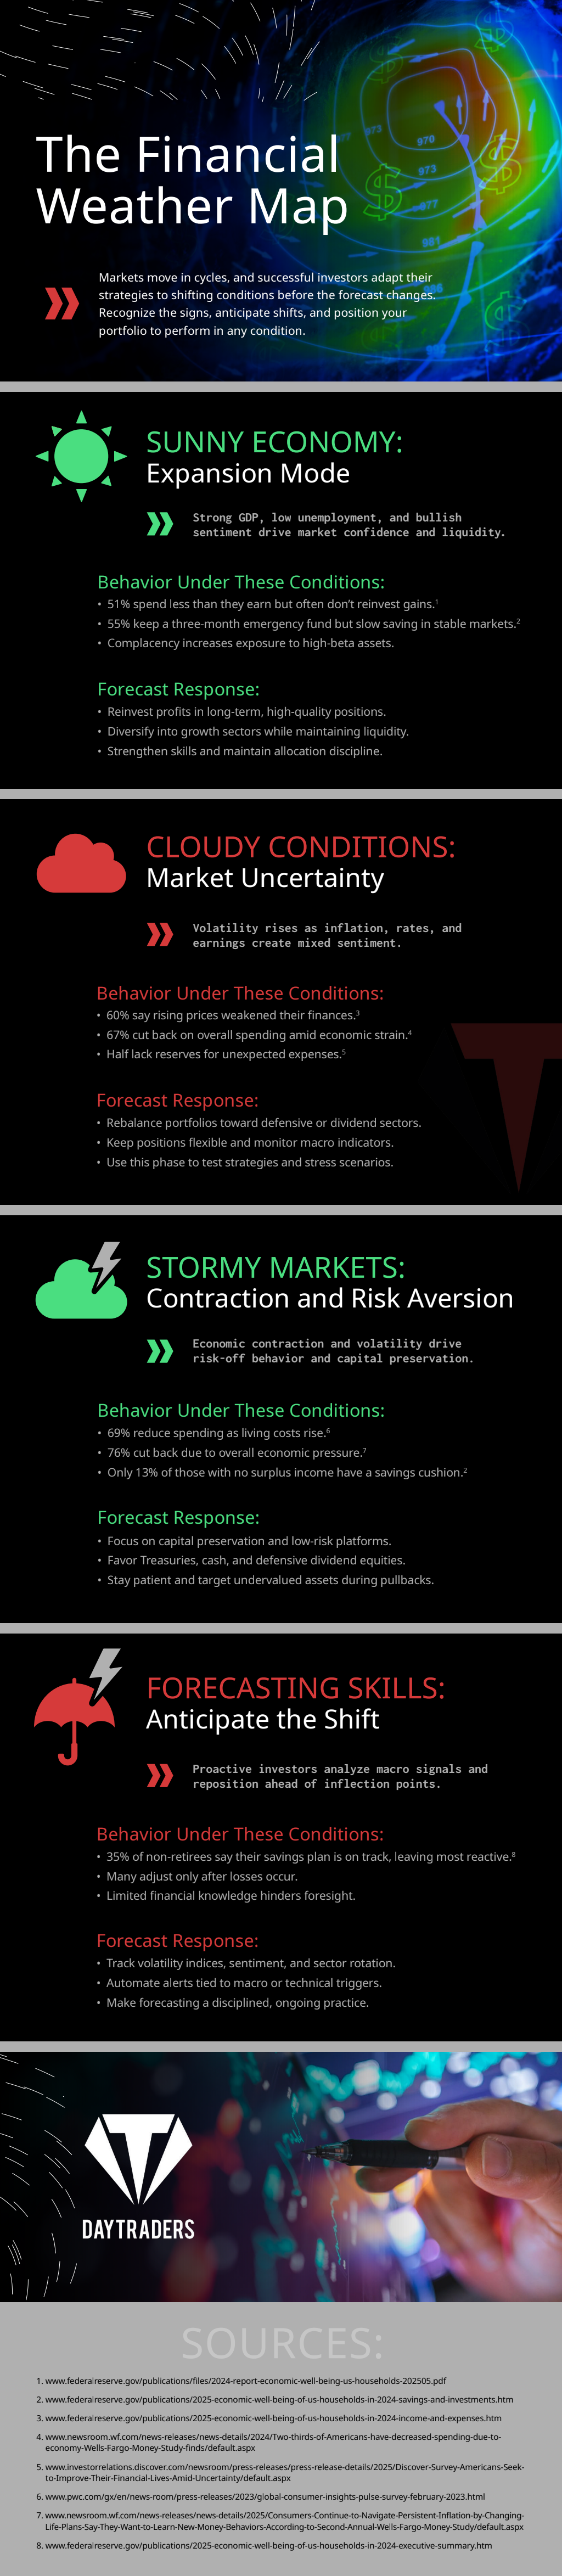
A financial weather map is a living view of risk, opportunity, and performance trends. Instead of focusing on static reports, it tracks patterns over time. Revenue movement, expense volatility, customer behavior, and market indicators act like pressure systems that suggest where storms or clear skies may form.
Data analytics turns raw financial information into forward-looking insight. By combining historical data with real-time inputs, businesses gain a clearer picture of what may happen next rather than only what already occurred.
Identifying Early Warning Signals
One of the most valuable roles of analytics is early detection. Small changes in receivables timing, supplier pricing, or customer churn often appear long before they affect profitability. Advanced dashboards highlight these shifts through trend analysis and anomaly detection.
More Read

For example, a gradual increase in payment delays across a customer segment may suggest upcoming cash flow stress. When leaders see this pattern early, they can adjust credit policies or outreach strategies before the impact spreads.
Connecting External and Internal Data
Financial health is shaped by forces both inside and outside the organization. Internal metrics such as margins, inventory turnover, and payroll costs interact with external factors like interest rates, consumer confidence, and supply market changes.
Analytics platforms bring these streams together. When internal sales data aligns with external economic indicators, decision-makers gain context that sharpens forecasts. This combined view helps leaders anticipate market headwinds or spot favorable conditions earlier than competitors.
Scenario Planning With Data Models
Weather maps do more than show current conditions. They project likely outcomes based on different scenarios. Financial analytics supports this approach through modeling and simulation.
Organizations can test how changes in pricing, staffing, or capital investment affect outcomes under various assumptions. These models help teams plan responses to both optimistic and conservative forecasts. Instead of debating gut feelings, leaders compare data-backed scenarios that reveal trade-offs and risk exposure.
Real-Time Insights for Faster Decisions
Financial conditions can change quickly. Static monthly reports may arrive too late to influence outcomes. Real-time analytics allows organizations to monitor performance continuously and respond with speed.
This approach is especially valuable in fast-moving environments such as trading operations or high-volume transaction businesses. Insights similar to those used in a day trader platform show how near real-time visibility can shape better timing and execution across broader financial operations.
Building Confidence Through Clarity
Uncertainty often fuels hesitation and reactive decisions. A financial weather map grounded in analytics replaces guesswork with visibility. Teams gain confidence because they understand why trends are forming and how different choices may play out.
Clear insight also improves communication across departments. Finance, operations, and leadership can align around shared data instead of conflicting interpretations. This alignment supports more consistent planning and execution.
Data analytics does not eliminate financial risk, but it transforms how organizations face it. By building a financial weather map that reflects real patterns and predictive insight, businesses move from reacting to storms toward planning for them. The result is steadier decision-making, improved resilience, and a clearer path through both calm and uncertain financial conditions. Look over the infographic below for more information.


