Cookies help us display personalized product recommendations and ensure you have great shopping experience.

By using this site, you agree to the Privacy Policy and Terms of Use.
Accept
SmartData CollectiveSmartData Collective
  • Analytics
    AnalyticsShow More
    image fx (67)
    Improving LinkedIn Ad Strategies with Data Analytics
    9 Min Read
    big data and remote work
    Data Helps Speech-Language Pathologists Deliver Better Results
    6 Min Read
    data driven insights
    How Data-Driven Insights Are Addressing Gaps in Patient Communication and Equity
    8 Min Read
    pexels pavel danilyuk 8112119
    Data Analytics Is Revolutionizing Medical Credentialing
    8 Min Read
    data and seo
    Maximize SEO Success with Powerful Data Analytics Insights
    8 Min Read
  • Big Data
  • BI
  • Exclusive
  • IT
  • Marketing
  • Software
Search
© 2008-25 SmartData Collective. All Rights Reserved.
Reading: A New Graphical Representation of the Periodic Table |…
Share
Notification
Font ResizerAa
SmartData CollectiveSmartData Collective
Font ResizerAa
Search
  • About
  • Help
  • Privacy
Follow US
© 2008-23 SmartData Collective. All Rights Reserved.
SmartData Collective > Big Data > Data Visualization > A New Graphical Representation of the Periodic Table |…
Data Visualization

A New Graphical Representation of the Periodic Table |…

JackMason
JackMason
2 Min Read
SHARE

A New Graphical Representation of the Periodic Table | VizWorld.com

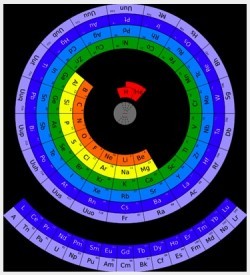
According to Mohd Abubakr from Microsoft Research in Hyderabad, the table can be improved by arranging it in circular form. He says this gives a sense of the relative size of atoms–the closer to the centre, the smaller they are–something that is missing from the current form of the table.

The Smarter Planet tumblelog is an outgrowth of IBM’s strategic initiative to help a world of smart systems emerge.

More Read

Looking at Trees to Understand the Forest
Visualizing Kickstarter Projects with R
Not All Queries Are Created Equal
The analytics of soccer
Learning R
Link to original post
To see just the posts related to the “new intelligence” — advanced business intelligence, predictive analytics, decision support and large scale data managment — try this link:
http://smarterplanet.tumblr.com/tagged/new_intelligence

 See this primer on Smarter Planet


A New Graphical Representation of the Periodic Table | VizWorld.com

According to Mohd Abubakr from Microsoft Research in Hyderabad, the table can be improved by arranging it in circular form. He says this gives a sense of the relative size of atoms–the closer to the centre, the smaller they are–something that is missing from the current form of the table.

The Smarter Planet tumblelog is an outgrowth of IBM’s strategic initiative to help a world of smart systems emerge.

Link to original post
To see just the posts related to the “new intelligence” — advanced business intelligence, predictive analytics, decision support and large scale data managment — try this link:
http://smarterplanet.tumblr.com/tagged/new_intelligence

 See this primer on Smarter Planet


Share This Article
Facebook Pinterest LinkedIn
Share

Follow us on Facebook

Latest News

image fx (2)
Monitoring Data Without Turning into Big Brother
Big Data Exclusive
image fx (71)
The Power of AI for Personalization in Email
Artificial Intelligence Exclusive Marketing
image fx (67)
Improving LinkedIn Ad Strategies with Data Analytics
Analytics Big Data Exclusive Software
big data and remote work
Data Helps Speech-Language Pathologists Deliver Better Results
Analytics Big Data Exclusive

Stay Connected

1.2kFollowersLike
33.7kFollowersFollow
222FollowersPin

You Might also Like

Some considerations when looking at dashboards

4 Min Read
Image
AnalyticsBig DataBusiness IntelligenceData MiningData QualityData VisualizationData WarehousingHadoopHardwareITLocationMapReduceOpen SourceSecuritySocial DataSoftwareSQLUnstructured DataWorkforce Data

How MapR’s M7 Platform Improves NoSQL and Hadoop

5 Min Read

Factoids, Stories and Insights

7 Min Read

The Anatomy of a Twitter Conversation, Visualized with R

3 Min Read

SmartData Collective is one of the largest & trusted community covering technical content about Big Data, BI, Cloud, Analytics, Artificial Intelligence, IoT & more.

AI and chatbots
Chatbots and SEO: How Can Chatbots Improve Your SEO Ranking?
Artificial Intelligence Chatbots Exclusive
ai in ecommerce
Artificial Intelligence for eCommerce: A Closer Look
Artificial Intelligence

Quick Link

  • About
  • Contact
  • Privacy
Follow US
© 2008-25 SmartData Collective. All Rights Reserved.
Go to mobile version
Welcome Back!

Sign in to your account

Username or Email Address
Password

Lost your password?