

I was left highly impressed, and still deeply curious, about the guts behind what I saw attending the ESRI User Conference in San Diego the week of July 14th, 2014, For those of you that don’t know, ESRI is the leader in GIS (geographic data, this is the data that makes up a map that Google, Bing, Mapquest, etc., present). You can see my Technorati write up about the show itself, but this column will dig deeper.
The impression I had leaving the conference, was that, essentially, all this GIS and user data magically existed and it was the vendors jobs to come up with interesting applications and innovative ways to present and make that data useful. ESRI was kind enough to set up an interview for me with David Totman, their Public Works, AEC (Architecture, Engineering and Construction), and Survey Industry Manager

Totman ran the survey program in Colorodo Springs. The pipes, the wires, making sure everything was in the right place from a survey perspective. They managed the electric, gas, water and waste water and are one of the largest four utility management groups in the country. Totman has been using the ESRI software since the late 80’s, so he has a great perspective on how the focus has changed over the years.
The commercialization of maps, especially satellite data maps, through companies like Google and Microsoft is a huge impetus behind the growth of awareness and use of maps, but unlike the aforementioned companies maps that really just present satellite data, the data that goes into an ESRI generated map is vastly more rich. For example, on a Bing map, you can zoom down pretty close and get some interesting detail. Going to street view will provide even more data, but again, this data is based on pictures. With an ESRI map and you click on a road, you can potentially see what the speed limit is, the material of the road, are there guardrails, to name a few items.
I’m not doing this in an interview format, there was too much give and take of information, I’m going to summarize down my questions and the information I got.
Q: How is GIS data collected?
ESRI is 45 years old and the GIS industry continues to mature. The rate of that maturation is speeding up tremendously as system become heterogeneous. The late 80’s and early 90’s were the era of data collection. The vendors back then were focused on digitizing the paper maps and breaking it down into data points. So in a city for example, this could be all the streets, traffic signals, fire hydrants, underground pipes, wiring for electrical, cable, phones, landscaping. You name it, and these assets are tracked (or should be).
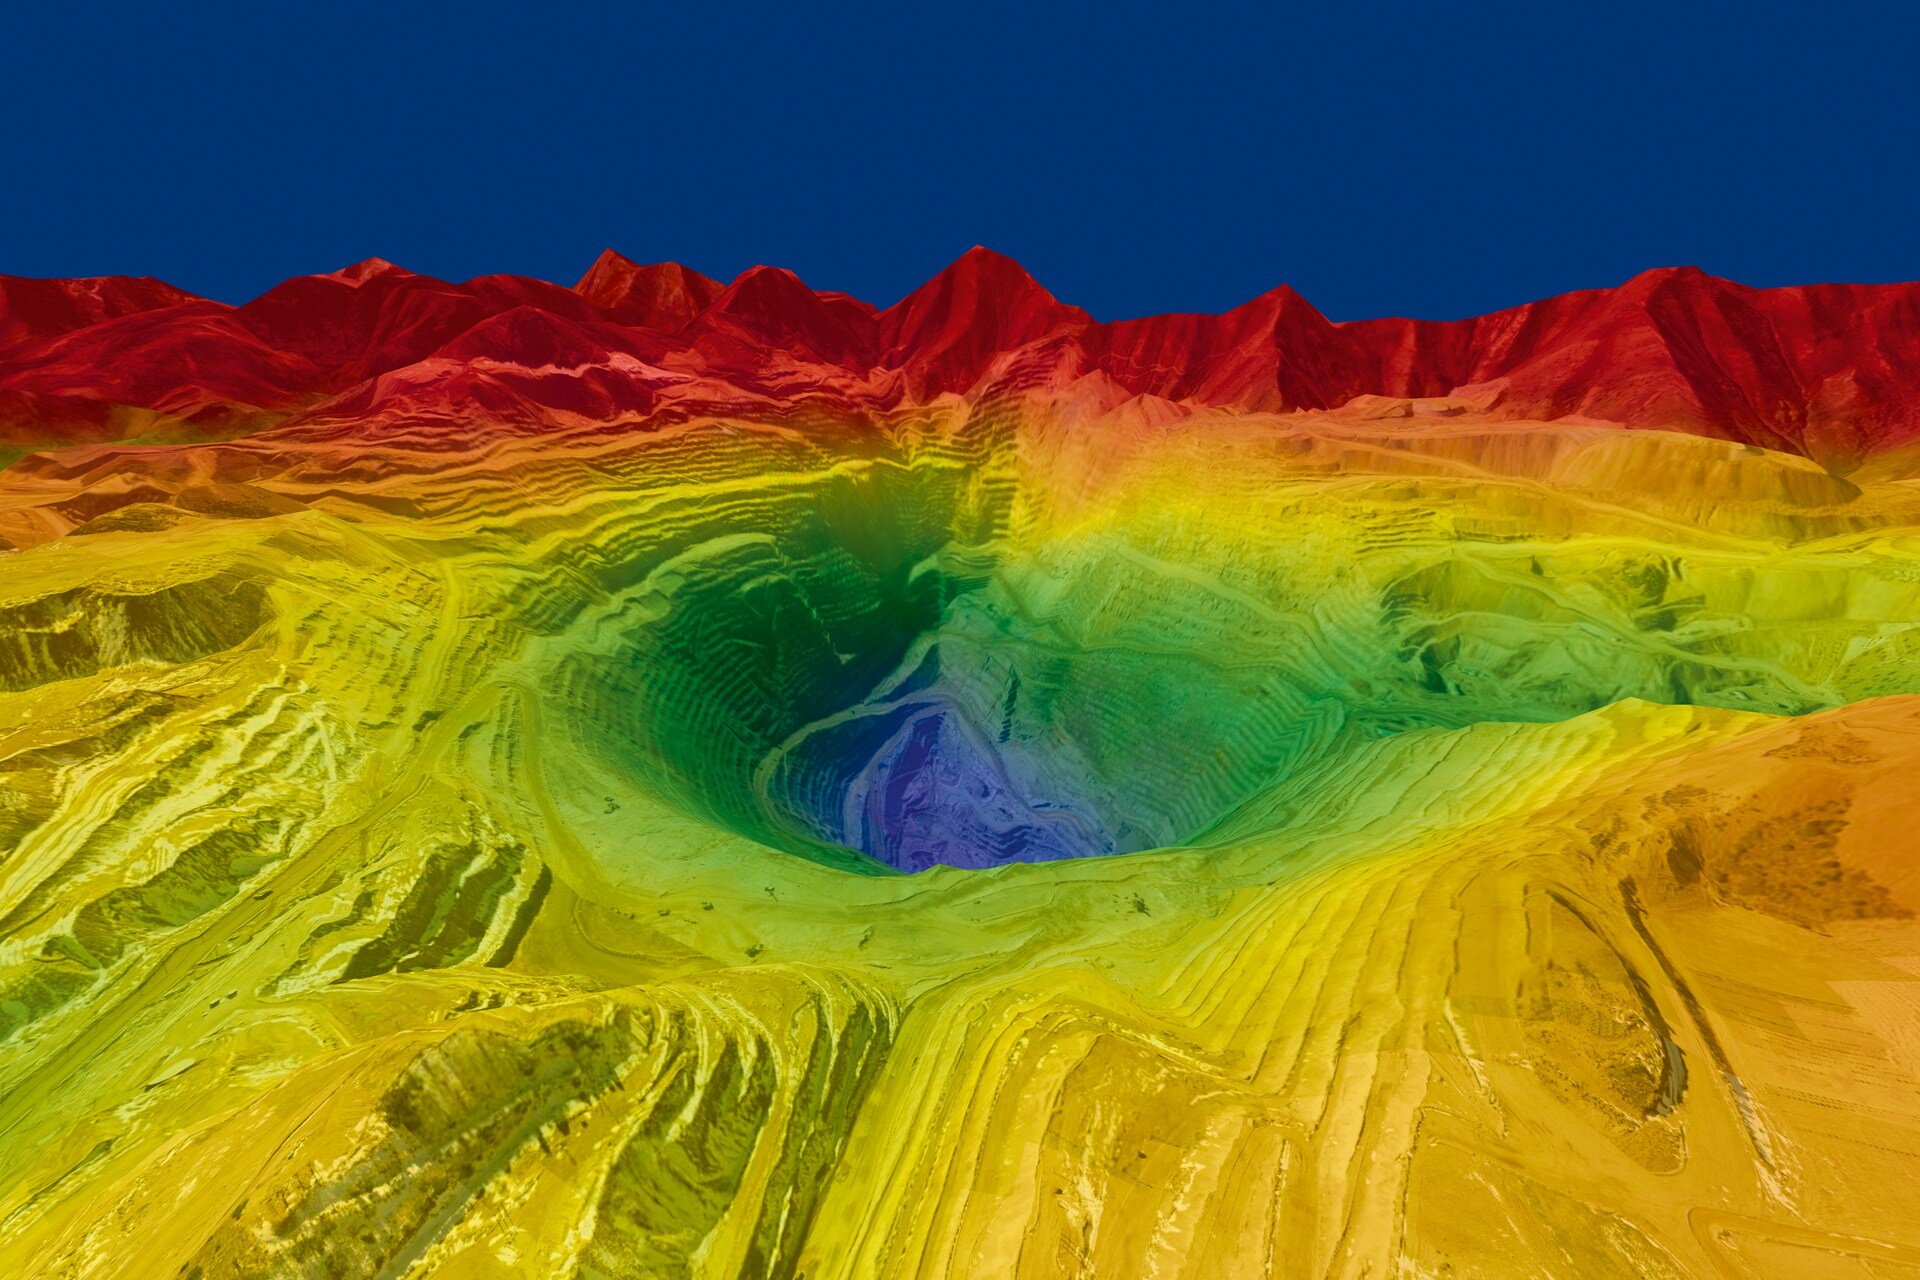
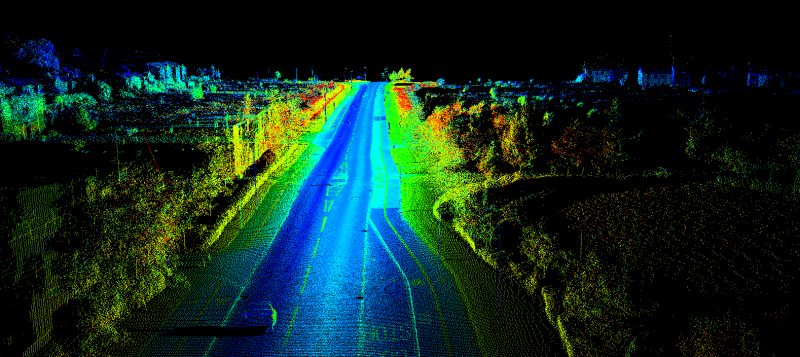
The hard reality is that a human had to just go and look at things and write them down, usually they’ve had an inventory from the original civil engineering, but that has to all be verified. The job of asset collection is just massive, however, technology to the rescue in the form of LIDAR (Laser Induced Differential Absorption Radar). These can be mounted on a car, plane, helicopter or even just mounted on a tripod and put in a room.
The LIDAR device is sending out millions of laser pulses to create a 3D image of the object or region in question, think of it as a 3D scan of an environment. An interesting case study that David told me about was the city of Troutdale Oregon with a population of 17,000 and an area of 6 square miles. Troutdale had recently taken their city asset data and thrown it up on a map and saw an enormous number of problems, like manhole covers on the sides of building, fire hydrants in the middle of a house, fun stuff like that.
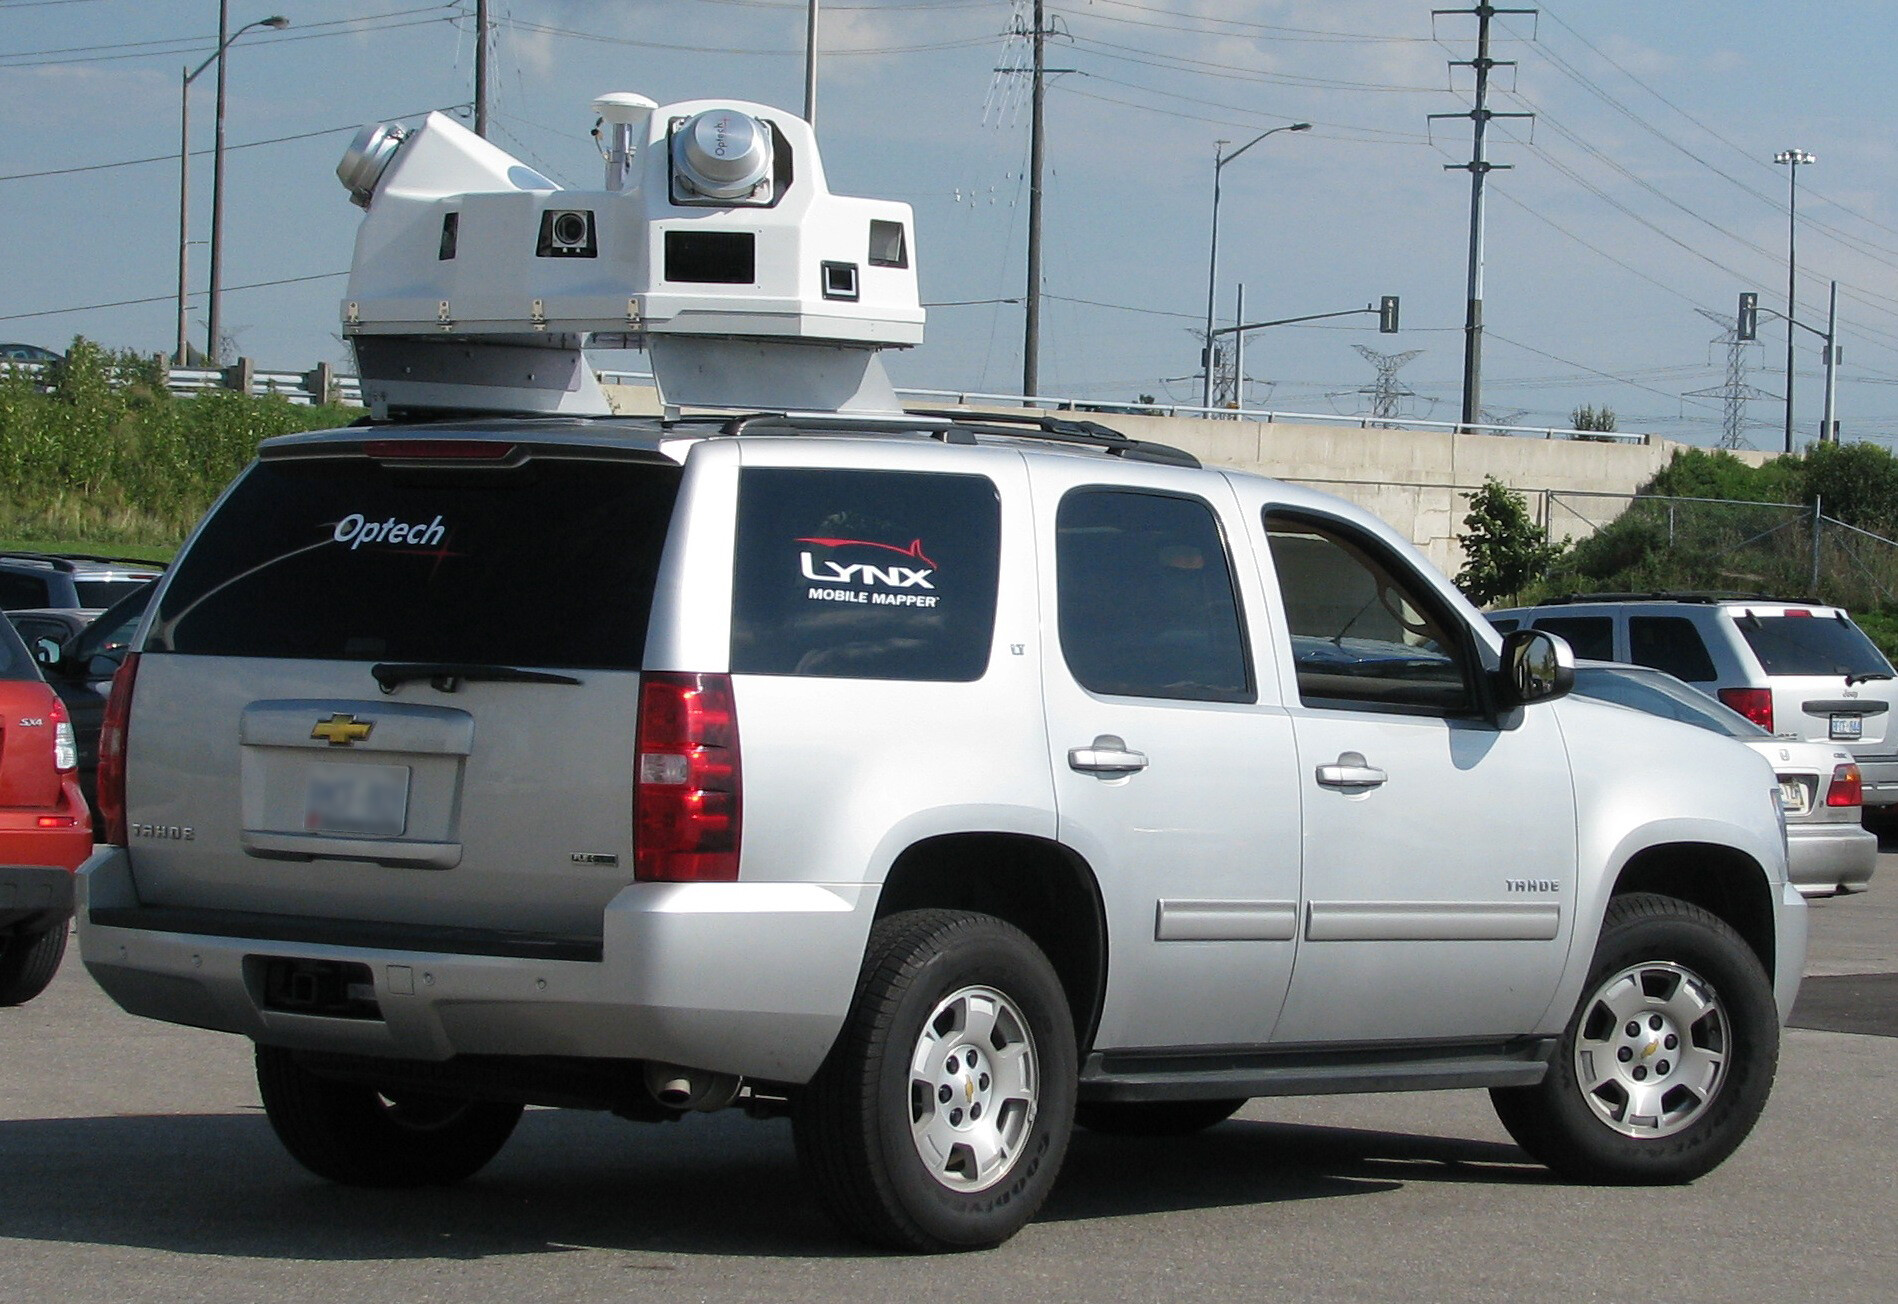
So the city rented a LIDAR car for about $7500 and spent a single day driving around the city and letting the LIDAR system do its work. Once you get back with the data, you can then play the data back and look at the data points. A human can then identify and assign each of those, or you can rent one of the available Artificial Intelligence system to chug through the data and do the work for you, then it just requires a human to QA the results. They will still be some time getting everything cataloged, but it is done now, as long as they track new issues and items, they shouldn’t have to go through this process again.
The upcoming trend is going to be UAV data collection, which takes it from driving a car around, to an Unmanned Aerial Vehicle, which is going to revolutionize the market again. Right now it is not legal in the US because the FAA doesn’t want them running in to commercial aircraft, so the relevant groups are looking in to how to do it safely. The “hobby” airspace, up to a few hundred feet, is still open, so it is ok to operate there. Privacy concerns and laws are still a big issue and have to be resolved, but think of the possibilities. Rapid data timeliness becomes a reality at this point. Imagine you have a flood zone, you can send out your drone, scans the area, comes back, you upload the data and generate a delta of the changes in the landscape to determine any potential engineering that might be required. You are able to review and evaluate remote issues without putting humans in potential danger just to see what might have happened.

Q: How is the data stored?
There is so much data that you can’t just throw a whole city up on to the display.ESRI has been working with “big data” solutions like Hadoop of late on public cloud services like Microsoft Azure and Amazon SE. To have high accuracy though, you have to store a lot of datapoints, all the dimensional and location data. Think about measuring every aspect of your city and what that would add up to. Yea, crazy.
Q: How is the data distributed?
The “ARCGis Online” product has a variety of data that you can get access to. Since the federal government and all the three letter acronym agencies of the government are customers of ESRI, any data that is publicly available, will be available to you. Any entity could decide to make their data public, for example, a city might want to make their road pavement data available to the public. This data could then be access by law enforcement, citizens or even news agencies to make use of for whatever reason. ESRI doesn’t own that data, they are hosting it.
Just to be clear, ESRI doesn’t have a data center, they are using Amazon S3 and Microsoft Azure as previously mentioned.
ESRI does have data sets of their own that are available both for free, and for licensing. They have their own demographers who come up with various cool products like “Tapestry”, which shows life groups and their habit patterns, so you could research in there and discover NASCAR fans are good at recycling. Some of their free data is the entire planet of National Geographic maps as part of their base maps. Clients can buy copies of the data to download and use or make use of the cloud copies, it depends on the vendor. A customer won’t typically download imagery however, it is just too voluminous. Speaking of the cloud, the latest mobile version of the ESRI collector app will now allow you to go offline to work on and collect data and then when you get back online it will autosync everything back up to the cloud.
A couple other interesting products that ESRI offers, are, “Community Analyst” and “Business Analyst”. With Community Analyst you could use this for social services or religious types of organizations. A thought would be population density versus gender and age to look for trends or groupings for support or activities.
With Business Analyst, you can look into various trends to determine the placement of a business for optimum return. I ran into a guy at the ESRI user conference who was explaining how they used this to determine where to put new Walgreens stores. I have always wondered how they make these decisions, especially when you see 3 Starbucks within 2 miles of each other.
I was surprised and glad to find out that both the city I live in and my church own ArcGIS, which means I might be able to convince them both to make better and more interesting use of the tools available. I hope this overview gives you some sense of what is possible with the software suite from ESRI, it might be that your organization already has it and isn’t using it.


