
Here is a quick visualization I did in honor of April 15th to investigate what people looking for on tax day…
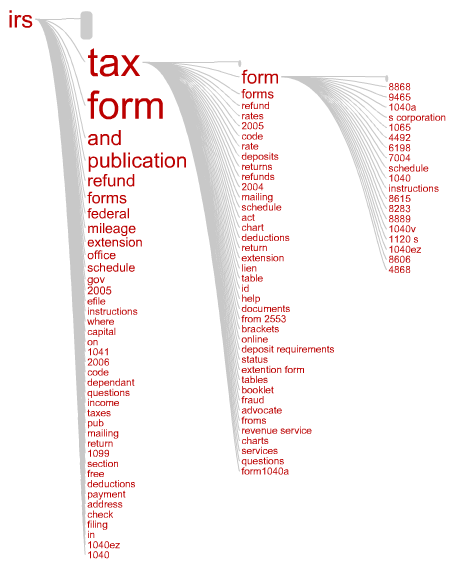
This “query tree” shows the most frequent searches starting with the term “irs”. Each branch in the tree represents a query where the words are sized according to frequency of occurrence. I like how you can see at a glance what the most popular tax forms are by following the “irs tax form …” branch.
It was created by uploading search queries from AOL users leading to clicks on irs.gov during Spring 2006 to Concentrate. This image is a snapshot of an interactive flash visualization, where the focus term was “irs”. Looking at query patterns like this can help you get an idea of what people are looking for and how to better organize your site so they can find it quickly.
The raw data is from the released AOL Search data sample, and consists of the subset of unique queries leading to clicks on irs.gov from March to May 2006. The IRS queries used to make the visualization can be downloaded here: irs.gov.queries.csv (191K)
Here are the top 10 queries in the file:
…
| Query | Searches |
| irs | 4787 |
| irs.gov | 2282 |
Here is a quick visualization I did in honor of April 15th to investigate what people looking for on tax day…
This “query tree” shows the most frequent searches starting with the term “irs”. Each branch in the tree represents a query where the words are sized according to frequency of occurrence. I like how you can see at a glance what the most popular tax forms are by following the “irs tax form …” branch.
It was created by uploading search queries from AOL users leading to clicks on irs.gov during Spring 2006 to Concentrate. This image is a snapshot of an interactive flash visualization, where the focus term was “irs”. Looking at query patterns like this can help you get an idea of what people are looking for and how to better organize your site so they can find it quickly.
The raw data is from the released AOL Search data sample, and consists of the subset of unique queries leading to clicks on irs.gov from March to May 2006. The IRS queries used to make the visualization can be downloaded here: irs.gov.queries.csv (191K)
Here are the top 10 queries in the file:
| Query | Searches |
| irs | 4787 |
| irs.gov | 2282 |
| www.irs.gov | 1975 |
| internal revenue service | 1154 |
| irs forms | 608 |
| tax forms | 361 |
| irs tax forms | 196 |
| internal revenue | 158 |
| taxes | 142 |
| wheres my refund | 139 |
| federal tax forms | 125 |
| irs refunds | 106 |
![]()


