
Due to poor planning and the caving in by politicians to special interest pressure, the state of California failed to build the infrastructure they needed back in the 70’s for adequate water retention, and now faces a crazy water crises. Governor Brown is trying to control who can use water and what it can be used for through executive fiat, and local municipalities are being taken to court (and losing) for trying to have illegal tiered pricing.
Due to poor planning and the caving in by politicians to special interest pressure, the state of California failed to build the infrastructure they needed back in the 70’s for adequate water retention, and now faces a crazy water crises. Governor Brown is trying to control who can use water and what it can be used for through executive fiat, and local municipalities are being taken to court (and losing) for trying to have illegal tiered pricing. Charging people more for water won’t make more water, but through the use of technology, water utilities can identify things like underground leaks and other sources of non-revenue water loss, specifically by using the “Nighttime FlowAnalysis” solution from Esri.
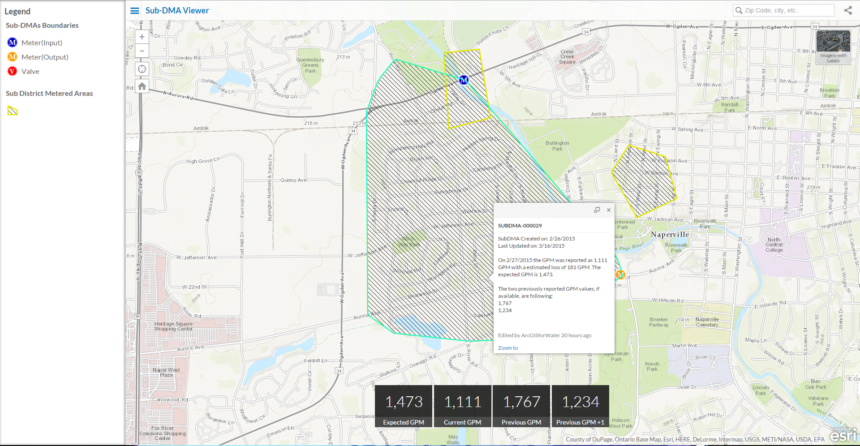
Nighttime Flow Analysis works by using an optimal time to analyze for leaks. This is typically at night, when household water consumption is significantly low. At the lowest point, the observed GPM from the area is entered into the solution. By comparing this observation to the expected flow, the utility can iterate through different Sub-DMA configurations and target the problems so they are fixed much sooner.

I had an opportunity to talk to David Totman, Industry Manager – Global Water Sector and ask him some questions about how the technology worked within their ArcGIS platform as it seemed to be a rather non-obvious use of the technology.
Shawn Gordon: I’ve reviewed the press release on your new Nighttime Flow Analysis offering, but our readers are more of the technical variety, so I want to dig into how this works. Obviously there are big water problems here in California especially, and every little bit helps. What can you tell me first about the ESRI ArcGIS components and setup required to use Nighttime Flow Analysis?
David Totman: The Nighttime Flow Analysis is a configuration of the ArcGIS platform. It includes a sample data model, automated scripts for installation, and maps and apps to run the analysis and display the results.
Shawn Gordon: Is this a new standalone component or what parts are required to make full use of it?
David Totman: It is a set of configured information products that makes use of ArcGIS Desktop for geodatabase network editing and model building that feeds browser-based apps for use with REST web services either in ArcGIS Server or ArcGIS Online.
Shawn Gordon: How significant or insignificant can the leak be for it to register? Are we talking ones, tens, hundreds of gallons per minute?
David Totman: The precision and the accuracy of the leak detection is a function of the customer’s pipe network, calibrated meters, and flow model. The Nighttime Flow Analysis tools are a configuration of maps and apps that provide complex information in a more readily understood format for decision making.
Shawn Gordon: How real time is the reporting, or is it raw data collection that you do analysis on later?
David Totman: The solution responds in real-time, meaning as soon as a user saves a sub-DMA, or a field staff enters observations all the apps that use that information are immediately updated. Because the solution was designed to be easily implemented the inputs from the flow meters are entered manually based on the observations made in the field. However, a more advanced configuration including a real-time or near real-time feed from the flow meter(s) could be configured.
Shawn Gordon: In the press release it talks about how this runs at night, so what is actually physically installed to gauge these flows or are you reading off existing meter infrastructure or is it a standalone analysis platform that you are entering data into from the monitoring systems?
David Totman: There are no physical metering devices from Esri, we leverage existing customer infrastructure. These meters that are used in the field are typically permanent. The application can be run at any time, however, step testing is typically done at night to observe base flow conditions. In some cases, this testing may done during the day when a significant loss is occurring.
Shawn Gordon: For those not in the know, what do the references to Sub-DMA and DMA refer to when using ArcGIS?
David Totman:
· District Metering Area (DMA): a predefined hydraulic system boundary that is isolated/controlled with primary meters to determine flow in/out of the DMA.
· Sub-District Metering Area (Sub-DMA): Sub-DMAs are used to temporarily further isolate and fine-tune the observed measurements within any given DMA.
Shawn Gordon: What is the pricing model for this or is it a flat rate? Can you give me some range or do you prefer to talk to the clients?
David Totman: This is a freely available configuration of the ArcGIS platform which requires at least one ArcGIS Desktop license and ArcGIS Online named user accounts.
Shawn Gordon: Thank you David, tools like yours are going to be extremely helpful as we try to navigate this current emergency. I know ArcGIS is widely installed, so I hope lots of your customers will take advantage of this feature.


