By using this site, you agree to the Privacy Policy and Terms of Use.
Accept
SmartData CollectiveSmartData Collective
  • Analytics
    AnalyticsShow More
    data Analytics instagram stories
    Data Analytics Helps Marketers Make the Most of Instagram Stories
    15 Min Read
    analyst,women,looking,at,kpi,data,on,computer,screen
    What to Know Before Recruiting an Analyst to Handle Company Data
    6 Min Read
    AI analytics
    AI-Based Analytics Are Changing the Future of Credit Cards
    6 Min Read
    data overload showing data analytics
    How Does Next-Gen SIEM Prevent Data Overload For Security Analysts?
    8 Min Read
    hire a marketing agency with a background in data analytics
    5 Reasons to Hire a Marketing Agency that Knows Data Analytics
    7 Min Read
  • Big Data
  • BI
  • Exclusive
  • IT
  • Marketing
  • Software
Search
© 2008-23 SmartData Collective. All Rights Reserved.
Reading: Watch 131 Years of Global Warming in 26 Seconds | Climate…
Share
Notification Show More
Aa
SmartData CollectiveSmartData Collective
Aa
Search
  • About
  • Help
  • Privacy
Follow US
© 2008-23 SmartData Collective. All Rights Reserved.
SmartData Collective > Big Data > Data Visualization > Watch 131 Years of Global Warming in 26 Seconds | Climate…
AnalyticsData Visualization

Watch 131 Years of Global Warming in 26 Seconds | Climate…

JackMason
Last updated: 2012/08/21 at 2:53 PM
JackMason
1 Min Read
SHARE

Watch 131 Years of Global Warming in 26 Seconds | Climate Central

Watch 131 Years of Global Warming in 26 Seconds | Climate Central

More Read

big data helping to save environment

Can Big Data Help Save The Environment?

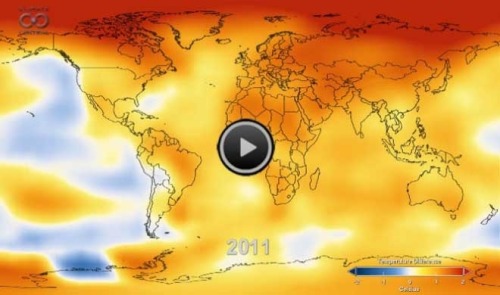
While temperatures have been blistering this summer, this video takes the longer historical view. It comes to us from our friends at NASA and is an amazing 26-second animation depicting how temperatures around the globe have warmed since 1880. That year is what scientists call the beginning of the “modern record.” You’ll note an acceleration of those temperatures in the late 1970s as greenhouse gas emissions from energy production increased worldwide and clean air laws reduced emissions of pollutants that had a cooling effect on the climate, and thus were masking some of the global warming signal. The data come from NASA’s Goddard Institute for Space Studies in New York, which monitors global surface temperatures. As NASA notes, “in this animation, reds indicate temperatures higher than the average during a baseline period of 1951-1980, while blues indicate lower temperatures than the baseline average.” 

TAGGED: global warming
JackMason August 21, 2012
Share This Article
Facebook Twitter Pinterest LinkedIn
Share

Follow us on Facebook

Latest News

data Analytics instagram stories
Data Analytics Helps Marketers Make the Most of Instagram Stories
Analytics
data breaches
How Hospital Security Breaches Devastate Local Communities
Policy and Governance
analyst,women,looking,at,kpi,data,on,computer,screen
What to Know Before Recruiting an Analyst to Handle Company Data
Analytics
data perspective
Tackling Bias in AI Translation: A Data Perspective
Big Data

Stay Connected

1.2k Followers Like
33.7k Followers Follow
222 Followers Pin

You Might also Like

big data helping to save environment
Big DataExclusive

Can Big Data Help Save The Environment?

5 Min Read

SmartData Collective is one of the largest & trusted community covering technical content about Big Data, BI, Cloud, Analytics, Artificial Intelligence, IoT & more.

AI chatbots
AI Chatbots Can Help Retailers Convert Live Broadcast Viewers into Sales!
Chatbots
data-driven web design
5 Great Tips for Using Data Analytics for Website UX
Big Data

Quick Link

  • About
  • Contact
  • Privacy
Follow US
© 2008-23 SmartData Collective. All Rights Reserved.
Go to mobile version
Welcome Back!

Sign in to your account

Lost your password?