

An interactive analytics application gives users the ability to run complex queries across complex data landscapes in real-time: thus, the basis of its appeal. The application presents a massive volume of unstructured data through a graphical or programming interface using the analytical abilities of business intelligence technology to provide instant insight. Furthermore, this insight can be modified and recalibrated by changing input variables through the interface. Interactive analytics applications present vast volumes of unstructured data at scale to provide instant insights.
The image above shows a typical example of an interactive analytics application. It shows that someone is interacting with the data changing different inputs to navigate through unstructured data.
Why Use an Interactive Analytics Application?
Every organization needs data to make many decisions. The data is ever-increasing, and getting the deepest analytics about their business activities requires technical tools, analysts, and data scientists to explore and gain insight from large data sets. Interactive analytics applications make it easy to get and build reports from large unstructured data sets fast and at scale.
There are many tools in the market right now to assist with building interactive analytics applications. In this article, we’re going to look at the top 5.
More Read

Top 5 Tools for Building an Interactive Analytics App
1. Firebolt
Firebolt makes engineering a sub-second analytics experience possible by delivering production-grade data applications & analytics. It is built for flexible elasticity: it can easily be scaled up or down in response to the workload of an application with just a click or an execution of a command.
It is scalable because of its decoupled storage and computed architecture. You can use firebolt programmatically through REST API, JDBC, and SDKs — that makes it easy to use. Firebolt is super-fast compared to other popular tools to build interactive analytics apps.
Firebolt also makes common data challenges such as slow queries and frequently changing schema easy to deal with at a reasonable price — $1.54/hour (Engine:1 x c5d.4xlarge).
2. Snowflake
Snowflake provides the right balance between the cloud and data warehousing, especially when data warehouses like Teradata and Oracle are becoming too expensive for their users. It is also easy to get started with Snowflake as the typical complexity of data warehouses like Teradata and Oracle are hidden from the users.
It is secure, flexible, and requires less management compared to traditional warehouses. Snowflake allows its users to unify, integrate, analyze, and share previously stored data at scale and concurrency through a management platform.
Snowflake offers a “pay for what you use” service but doesn’t state a price; they only highlight the “start for free” button on the website.
3. Google BigQuery
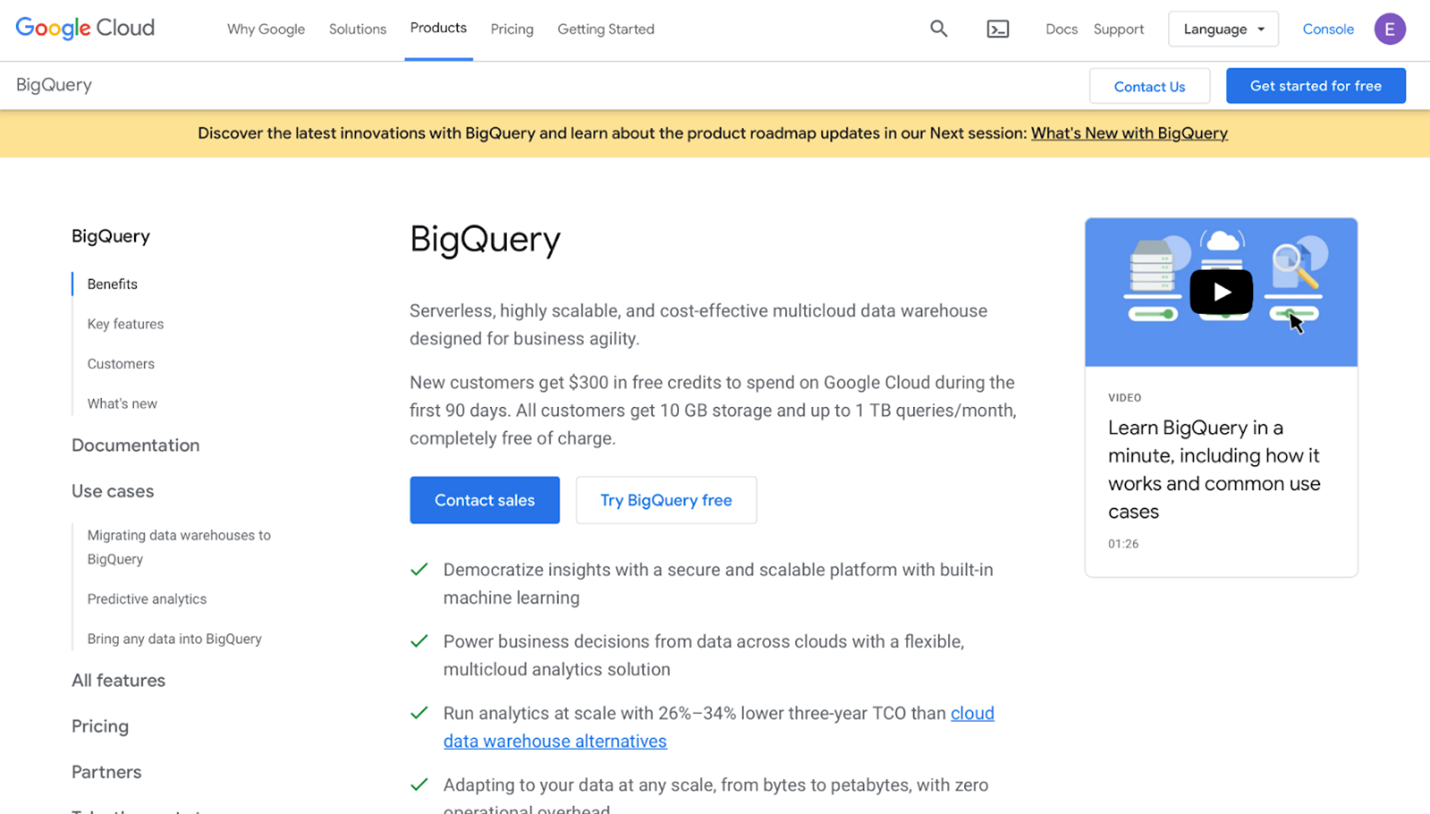
Google BigQuery is a serverless and cost-effective multi-cloud data warehouse. It is designed for business agility, and that is why it is highly scalable. It offers new customers $300 in free credits during the first 90 days. BigQuery also takes it further by giving all of their customers 10 GB storage and up to 1 TB queries/month for free.
Its built-in machine learning makes it possible for users to gain insights predictive and real-time analytics. Accessing data stored on Google BigQuery is secured with default and customer-managed encryption keys, and you can easily share any business intelligence insight derived from such data with teams and members of your organization with a few clicks.
Google BigQuery also claims to provide 99.99% uptime SLA. It offers a “pay for what you” service.
4. Druid
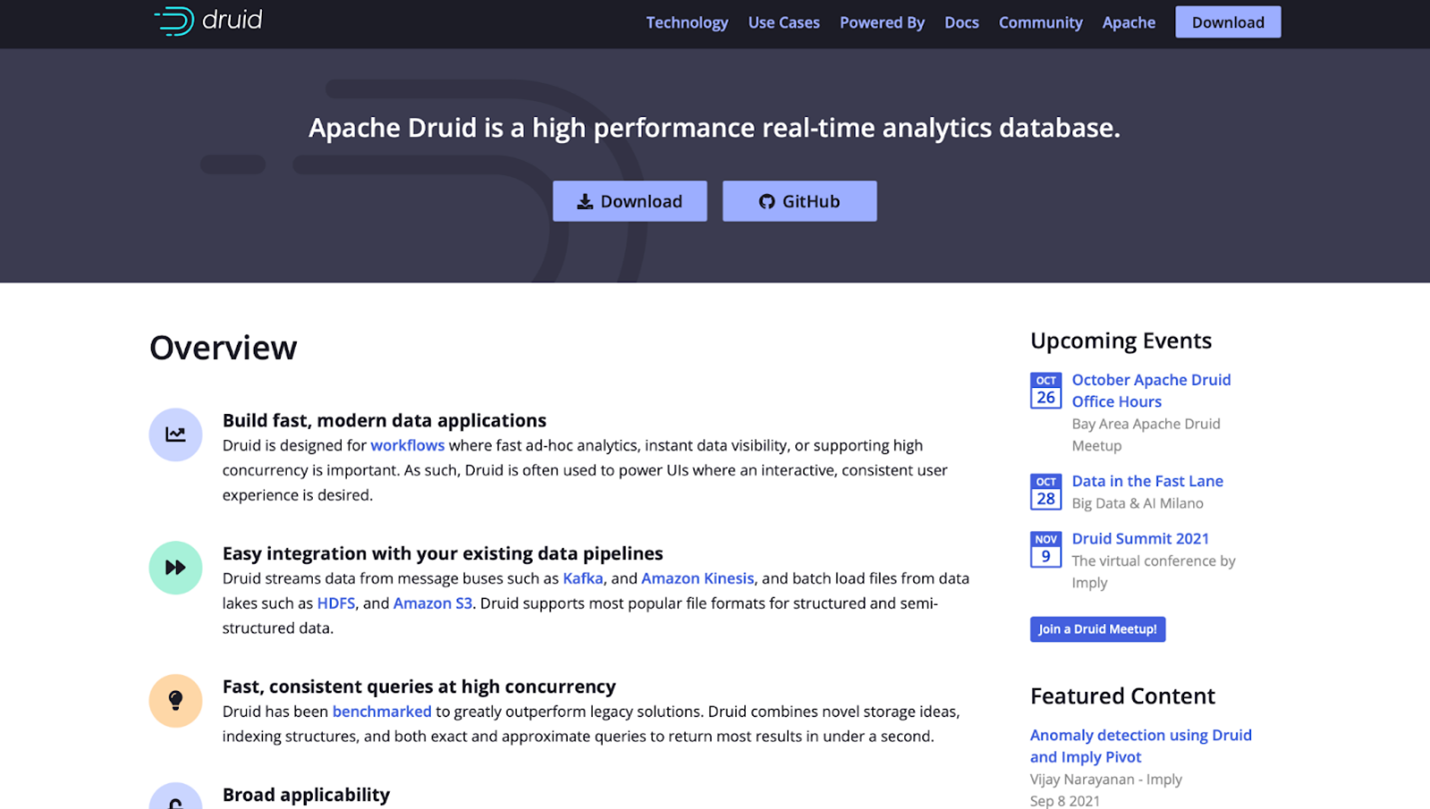
Druid is a real-time analytics database from Apache. It is a high-performing database that is designed to build fast, modern data applications. Druid is specifically designed to support workflows that require fast ad-hoc analytics, concurrency, and instant data visibility are core necessities.
It is easy to integrate with any existing data pipelines, and it can also stream data from the most popular message buses such as Amazon Kinesis and Kafka. It can also batch load files from data lakes such as Amazon S3 and HDFS. Druid is purposefully built to deploy in public, private, and hybrid clouds and use indexing structures, exact and approximate queries to get the most results fast.
Druid has no initial price.
5. Amazon Redshift
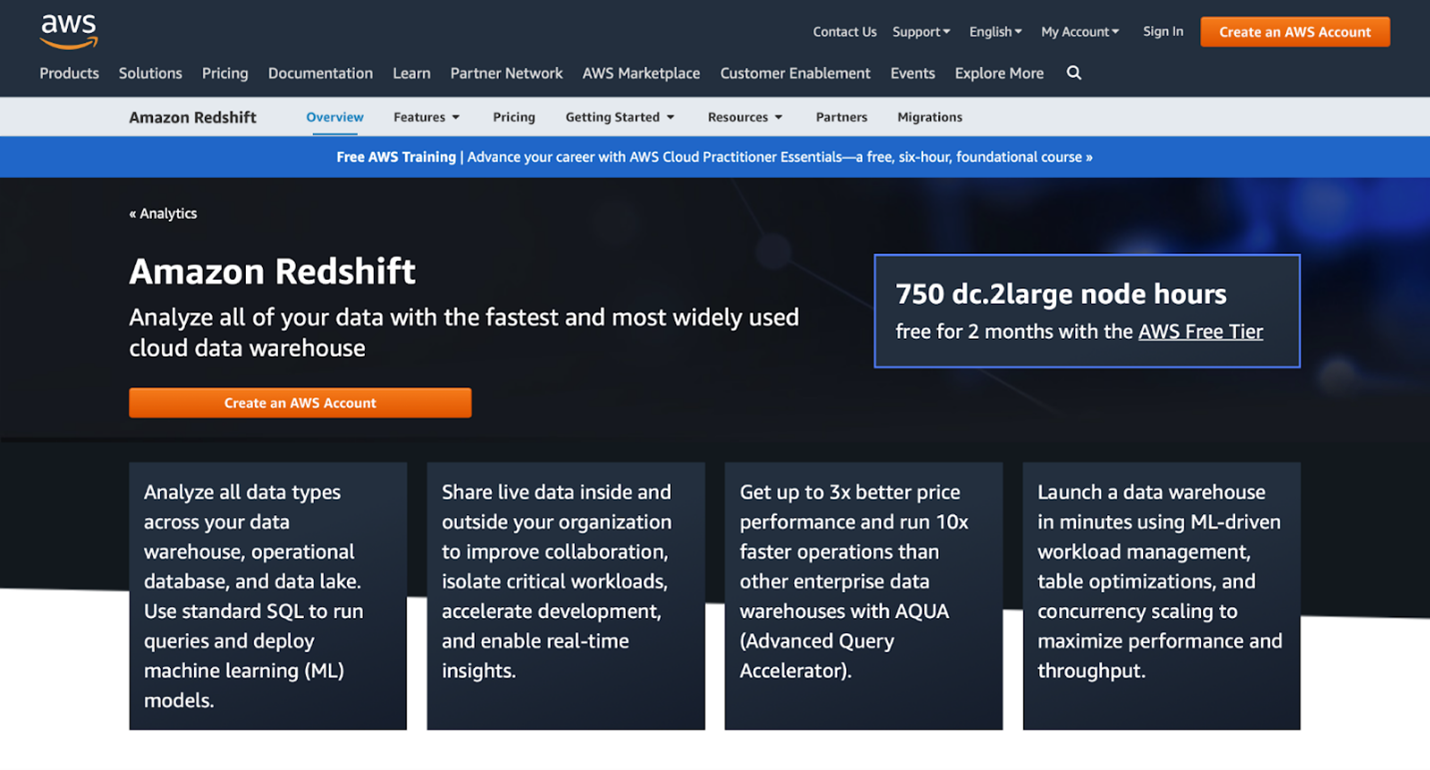
Amazon Redshift is a fast and widely used data warehouse. It is a fully managed and scalable data warehouse service that is cost-effective to analyze all your data with existing business intelligence tools efficiently. It is easily integrated with the most popular business intelligence tools like Microsoft PowerBI, Tableau, Amazon QuickSight, etc.
Like other listed data warehouses, it is optimized for datasets ranging from a few hundred gigabytes to a petabyte or more to build insight-driven reports and dashboards at costs less than $1,000 per terabyte per year. That is very cheap compared to traditional data warehouses. In addition, Amazon Redshift ML can automatically create, train, and deploy Amazon SageMaker ML. You can also access real-time operational analytics with the capability of Amazon Redshift.
Conclusion
Building interactive analytics applications are critical for organizations to get quick insight that can help their operations. Interactive analysis applications work best with accessible data centralized in a data warehouse; therefore, there is a need to have analysis tools that make building applications easy, effective and efficient.
For this purpose, this article’s tools such as Firebolt, Snowflake, Amazon Redshift, Google BigQuery, and Apache Druid are very suitable. If you are building an interactive analysis application, pick one of them that is suitable for your needs in terms of efficiency, cost, and scalability and run with it.


