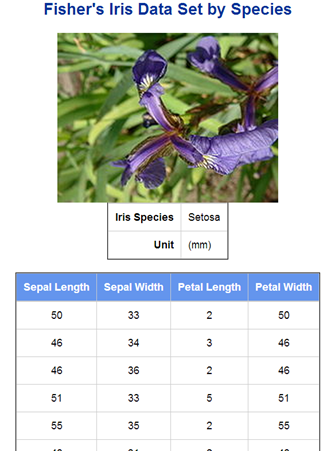
I personally nominated SAS ODS Report Writing Interface as one of the best technologies I found in SAS in 2012. It can generate reports cell by cell and row by row and provides a lot of flexibility to produce highly customized reports. Basically, to use it,
- first assign an ODS destination. Nothing new, and I prefer HTML like
ods html file=”output.html” style=sasweb;
- then create a object(instance) based on the ODS Report Writing class, odsout,
declare odsout myout();
ODS Report Writing Interface holds some so-called object-oriented features. Odsout is a predefined class (or, a SET, a CONTAINER), then you take from it an instance or an object, myout(or any other legal SAS variable names). Suppose Odsout is a class for apples, then myout is a specific apple.
- apply methods associated with the Odsout class, like CELL, ROW, TABLE to generate reports.
Roughly methods are just the functions (subroutines, procedures) in the object oriented world. For example, in SAS Data Steps, you use function weight(apple) to get the weight of the apple; in object oriented world, you use apple.weight() to return the same thing. In ODS Report Writing Interface, if you want to get a table, use TABLE methods:
- myout.TABLE_START() to start a table
- myout.TABLE_END to end a table
Then all we need to do next is to use the flexible SAS data steps to leverage the ODS Report Writing Interface methods (see docs). The codes, you can see below, are pretty verbose compared to its counterparts, PROC REPORT, but that’s why it gains power to build highly customized reports. It’s also very structural (and easy to build, like playing blocks):
/*making a sortable HTML table*/
%macro ods_html_sort_table;
%mend;
title ;
ods listing close;
ods html file=”a:\test\iris.html” style=sasweb headtext=”%ods_html_sort_table”;
data _null;
set sashelp.iris;
by Species;
/* create an object, obj, based on the ODS Report Writing class, odsout*/
if _n_ = 1 then do;
dcl odsout obj();
end;
if (first.Species) then do; *by group processing;
obj.title(text: “Fisher’s Iris Data Set by Species”); *title;
/* start a table*/
obj.table_start();
obj.row_start();
if (Species = “Setosa”) then
obj.image(file: “Iris_setosa.jpg” );*insert image;
else if (Species = “Versicolor”) then
obj.image(file: “Iris_versicolor.jpg” );
else if (Species = “Virginica”) then
obj.image(file: “Iris_virginica.jpg” );
obj.row_end();
obj.row_start();
obj.format_cell(text: “Iris Species”, overrides: “fontweight=bold just=right” );
obj.format_cell(text: Species, column_span: 3, overrides: “just=left”);
obj.row_end();
obj.row_start();
obj.format_cell(text: “Unit”, overrides: “fontweight=bold just=right” );
obj.format_cell(text: “(mm)”, column_span: 3, overrides: “just=left”);
obj.row_end();
obj.table_end();
/* start another table */
obj.table_start();
obj.head_start();
obj.row_start();
obj.format_cell(text: “Sepal Length” , overrides: “fontweight=bold”);
obj.format_cell(text: “Sepal Width” , overrides: “fontweight=bold”);
obj.format_cell(text: “Petal Length” , overrides: “fontweight=bold”);
obj.format_cell(text: “Petal Width” , overrides: “fontweight=bold”);
obj.row_end();
obj.head_end();
end;
obj.row_start();
obj.format_cell(data: SepalLength);
obj.format_cell(data: SepalWidth);
obj.format_cell(data: PetalWidth);
obj.format_cell(data: SepalLength);
obj.row_end();
if (last.Species) then do;
obj.table_end();
obj.note(data: “Note: These Tables are Sortable.”); *note;
obj.foot_start(); *footer;
obj.row_start();
obj.cell_start();
obj.format_text(data: “Footer: Data from SAS V&sysver at &sysscp &sysscpl Sashelp.iris”,just:”C”);
obj.cell_end();
obj.row_end();
obj.foot_end();
obj.page();
end;
run;
ods html close;
ods listing;
Note:
- A flavor added to get a sortable HTML report. Thanks to Charlie Huang and then Andrew Z to introduce a Javascript library JQury to SAS HTML report.
- The full report, see here.
- If column spannings needed, use the following codes as header (and the report here):
obj.head_start();
obj.row_start();
obj.format_cell(text: “Sepal” , overrides: “fontweight=bold”,column_span: 2);
obj.format_cell(text: “Petal” , overrides: “fontweight=bold”,column_span: 2);
obj.row_end();
obj.row_start();
obj.format_cell(text: “Length” );
obj.format_cell(text: “Width” );
obj.format_cell(text: “Length” );
obj.format_cell(text: “Width” );
obj.row_end();
obj.head_end();
- ODS Report Writing Interface will get rid of its preproduction hat since SAS 9.4, but you can use it somehow since SAS 9.1.3. For more, see the draft SAS 9.4 ODS documentation with ODS Report Writing Interface.
- To get started, see the developer’s paper.


