I recently attended a day long, hands-on, academy session for SAP HANA at the SAP offices in Chicago and thought that it would be worthwhile to share my impressions of the product. I will say that my exposure to HANA was limited, but the time spent was eye-opening and I definitely see how this could be a disruptive and evolutionary technology within the traditional world of data warehousing and business intelligence.
I recently attended a day long, hands-on, academy session for SAP HANA at the SAP offices in Chicago and thought that it would be worthwhile to share my impressions of the product. I will say that my exposure to HANA was limited, but the time spent was eye-opening and I definitely see how this could be a disruptive and evolutionary technology within the traditional world of data warehousing and business intelligence.
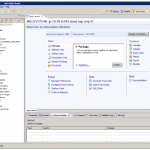
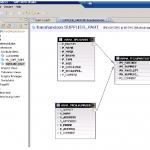
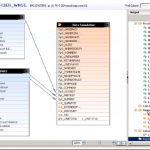
During the academy day we were able to walk through the entire process of getting the data loaded in to HANA via Data Services through consuming the data with BusinessObjects Explorer. For the record, the OLTP system used was an open source database which in my mind answered the question about how HANA handles data that is manages outside of SAP. Once the data was resident in HANA, we were able to open the HANA Studio and begin working immediately. The list of tables and objects were on the left side of the screen and very quickly we were walked through the user interface, and began to assemble our first attribute (or dimension). This was very simply achieved by bringing three of the OLTP tables together to form a customer attribute. The three tables were joined by their common keys, the structure was validated and then it was published to the HANA system. We repeated the process to create a Supplier-Part dimension, again utilizing three OLTP tables. Once these attribute tables were complete we created a two table view that would become the fact table.
It is worth noting that we were only able to pull measures from one of the two fact tables, so if you have multiple tables that have measures resident on them you would have to create multiple fact tables. I do not know if you would be able to reference multiple fact tables as you can within a tool like Microsoft Analysis Services, so I don’t know if multiple fact tables is a practical strategy to handle measures on multiple fact tables.
With these three attributes (two “dimensions” and one “fact”) created we moved on to make our first analytic view, which takes the three attributes and combines them into a star schema-like structure which can be then used by any of the BusinessObjects suite tools. Now it may seem as if I have simplified the process, but it is really that easy to move from OLTP to a Star and begin consuming the data in an analytic sense.
There is also a calculation engine the we used to create current year and prior year measures from the analytic view we created. The way we accomplished this was by hard coding the dates into a query filter. While this isn’t a sustainable way to create these (as they would have to be re-coded each year) it was such a simple process you could argue that the maintenance didn’t matter. On the flip side, we are only talking about one calculation engine object, and if there we 50 or 100 or 1000 HANA objects it may become an issue. I do not know if there is a dynamic way to do date filtering, but there are functions available so I am going to assume that it does have those capabilities. This brings me to the idea of the objects being highly disposable. With the speed that objects are created, analysts and developers can innovate with their data and throw away things that didn’t work and not feel guilty about wasted time or resources.
If you think about the data warehouse development life cycle you generally follow these steps: requirements, modeling, ETL coding, OLAP cube design, universe design, and report/visualization development. When you introduce HANA into the equation the modeling, ETL coding and OLAP cube design become obsolete and you shift your development timeline from months to days if your data is well-organized and managed. Also, consider that most data warehousing refresh on a nightly basis, which in most cases is “good enough” but if you are building view directly on the OLTP system you have move to real-time reporting (at least for SAP data if you ERP system or other SAP application are sitting on HANA). Systems residing outside of HANA could be updated in a much more timely manner as well as you are simply moving the data from their resident databases to HANA as a copy and not complex transformations.
HANA is a technology that I am looking forward to seeing evolve within the Business Intelligence community and I’m curious how other long-term data warehousing and business intelligence professional view HANA… it is a threat to the way of life we know, or simple the next evolution that we must embrace?
Bottom line, if you’ve got the budget dollars, and the highly managed data in your source systems then you can make a strong argument to bring HANA into your environment. On the other hand, if you have data challenges around quality or master data management you should probably address those issues first before a major investment like HANA because you won’t see the ROI.


