Cookies help us display personalized product recommendations and ensure you have great shopping experience.

By using this site, you agree to the Privacy Policy and Terms of Use.
Accept
SmartData CollectiveSmartData Collective
  • Analytics
    AnalyticsShow More
    image fx (67)
    Improving LinkedIn Ad Strategies with Data Analytics
    9 Min Read
    big data and remote work
    Data Helps Speech-Language Pathologists Deliver Better Results
    6 Min Read
    data driven insights
    How Data-Driven Insights Are Addressing Gaps in Patient Communication and Equity
    8 Min Read
    pexels pavel danilyuk 8112119
    Data Analytics Is Revolutionizing Medical Credentialing
    8 Min Read
    data and seo
    Maximize SEO Success with Powerful Data Analytics Insights
    8 Min Read
  • Big Data
  • BI
  • Exclusive
  • IT
  • Marketing
  • Software
Search
© 2008-25 SmartData Collective. All Rights Reserved.
Reading: A Cornucopia of Complicated Communications
Share
Notification
Font ResizerAa
SmartData CollectiveSmartData Collective
Font ResizerAa
Search
  • About
  • Help
  • Privacy
Follow US
© 2008-23 SmartData Collective. All Rights Reserved.
SmartData Collective > Business Intelligence > Market Research > A Cornucopia of Complicated Communications
Market Research

A Cornucopia of Complicated Communications

AnniePettit
AnniePettit
3 Min Read
SHARE

Research reports are a cornucopia of complicated statistical representations. Or, if I may say in simpler terms, a lot of fancy numbers.

Research reports are a cornucopia of complicated statistical representations. Or, if I may say in simpler terms, a lot of fancy numbers. As researchers, we get so engrossed in the statistical analyses, visual representations, and factual reporting that we forget how our experience with research and statistics differs from the experiences of other people.
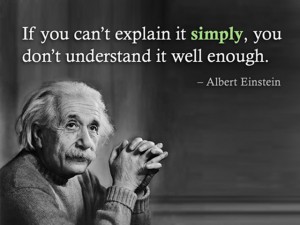
We forget that our readers may not have take years of statistics and research methods class and therefore don’t always understand how statistics work, why sample size matters, why effect size matters, or even what these terms mean. We forget that our world is very different from the world of a brand manager, a marketer, a consumer, a CEO. We speak in researchese not peoplese.

With that in mind, consider these excellent and accurate definitions of a t-test.

More Read

Big Data? Big Deal.
Retail Data And Shopping In The Digital Age
Decision Automation: How To Augment Predictive Analytics with Human Intelligence
Data, Data Everywhere
Business Intelligence for Revenue Assurance in the Communication Industry
  1. A t-test is any statistical hypothesis test in which the test statistic follows a Student’s t distribution if the null hypothesis is supported.
  2. A statistical examination of two population means. A two-sample t-test examines whether two samples are different and is commonly used when the variances of two normal distributions are unknown and when an experiment uses a small sample size.
  3. In statistics, a t-test is what the distribution will be if a student’s null hypothesis is true. The usual form for t-test statistics is T=Zls.
  4. The t–test is a simple test of the separation of two sets of data, and is used to determine significance of experimental results.
  5. The t-test tells you if the average number for one group is different from the average number for another group. (e.g., the average height of women vs the average height of men)

So tell me, which definition made the most sense to you? I’m going to guess it’s option number 5. This is the only option that avoided standard statistical terms and brought the language into the sphere of a regular person in the regular world. Most people should feel confident in their ability to share that information with other people no matter what their experience with statistics is.

The researcher’s goal is to share information, to communicate clearly, and to help other people understand what we are saying. So my suggestion to you is this.

Speak simply. Write simply. Be understood.

TAGGED:communications
Share This Article
Facebook Pinterest LinkedIn
Share

Follow us on Facebook

Latest News

image fx (2)
Monitoring Data Without Turning into Big Brother
Big Data Exclusive
image fx (71)
The Power of AI for Personalization in Email
Artificial Intelligence Exclusive Marketing
image fx (67)
Improving LinkedIn Ad Strategies with Data Analytics
Analytics Big Data Exclusive Software
big data and remote work
Data Helps Speech-Language Pathologists Deliver Better Results
Analytics Big Data Exclusive

Stay Connected

1.2kFollowersLike
33.7kFollowersFollow
222FollowersPin

You Might also Like

The Changing World of Communications

5 Min Read

Social Collaboration Is in Finance’s Future

9 Min Read
AI in internal communications
Artificial IntelligenceExclusive

AI Can Do Wonders to Improve Internal Communication

5 Min Read

SmartData Collective is one of the largest & trusted community covering technical content about Big Data, BI, Cloud, Analytics, Artificial Intelligence, IoT & more.

ai chatbot
The Art of Conversation: Enhancing Chatbots with Advanced AI Prompts
Chatbots
AI and chatbots
Chatbots and SEO: How Can Chatbots Improve Your SEO Ranking?
Artificial Intelligence Chatbots Exclusive

Quick Link

  • About
  • Contact
  • Privacy
Follow US
© 2008-25 SmartData Collective. All Rights Reserved.
Go to mobile version
Welcome Back!

Sign in to your account

Username or Email Address
Password

Lost your password?