We use cookies, including third-party cookies from Google to serve personalized ads through AdSense, to operate this site and understand how it is used. By continuing to browse, you accept this use. See our Privacy Policy and Terms of Use for details, including how to opt out of personalized advertising.
Accept
SmartData CollectiveSmartData Collective
  • Analytics
    AnalyticsShow More
    chatgpt image jul 21, 2026, 04 34 30 pm
    4 Core Benefits of Predictive Maintenance after Vibration Analysis
    10 Min Read
    How Does Data Mining Boost Customer Satisfaction in Logistics? Harnessing Analytics for Results -- AI-generated illustration
    How Does Data Mining Boost Customer Satisfaction in Logistics? Harnessing Analytics for Results
    11 Min Read
    chatgpt image jul 13, 2026, 04 23 45 pm
    How Data Analytics Helps Companies Improve User Engagement
    19 Min Read
    chatgpt image jul 13, 2026, 03 59 46 pm
    How Data Analytics Improves Multi-Location Search Strategies
    10 Min Read
    cybersecurity efforts
    How Behavioral Analytics and AI Are Redefining Cybersecurity for Boca Raton Businesses
    14 Min Read
  • Big Data
  • BI
  • Exclusive
  • IT
  • Marketing
  • Software
Search
© 2008-25 SmartData Collective. All Rights Reserved.
Reading: Experience vs. Data: Consuming Mark Zuckerberg as Data
Share
Notification
Font ResizerAa
SmartData CollectiveSmartData Collective
Font ResizerAa
Search
  • About
  • Help
  • Privacy
Follow US
© 2008-23 SmartData Collective. All Rights Reserved.
SmartData Collective > Big Data > Data Mining > Experience vs. Data: Consuming Mark Zuckerberg as Data
CommentaryData MiningData QualityData VisualizationDecision Management

Experience vs. Data: Consuming Mark Zuckerberg as Data

StephenBaker1
StephenBaker1
2 Min Read
Experience vs. Data: Consuming Mark Zuckerberg as Data
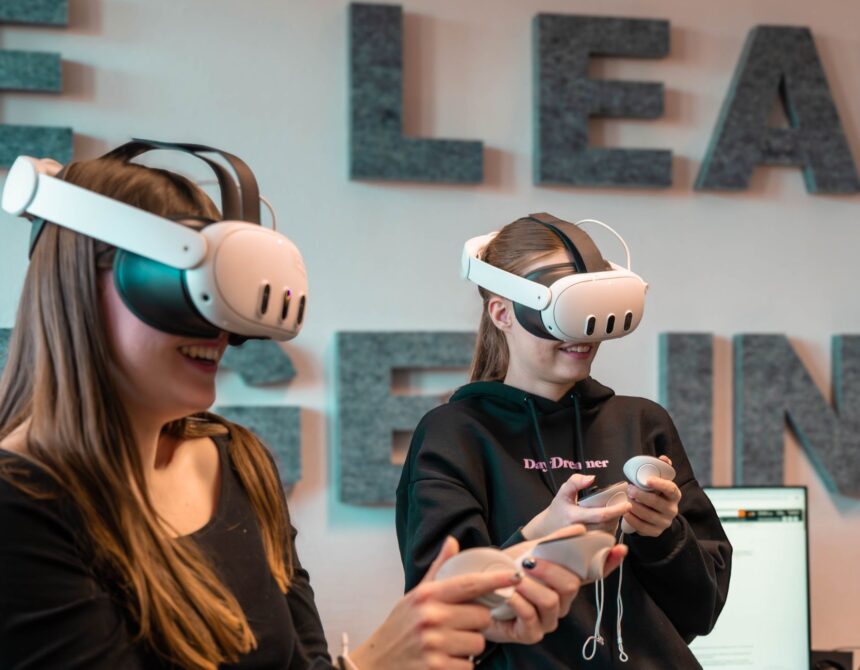
Photo by Md Jawadur Rahman on Pexels (https://www.pexels.com/photo/women-enjoying-virtual-reality-gaming-indoors-34987117/)
SHARE

One day last month, a dazzling sunny day in Paris, I faced a choice: Do I spend my last afternoon in a crowded tent listening to Facebook’s Mark Zuckerberg, or do I dash across the river from the Tuileries and make a quick visit to the Musee d’Orsay (below)?

I ended up bagging Zuckerberg. The decision boiled down to a question of experience vs. data. The walk across central Paris to the museum would be an experience. What I would learn from Mark Zuckerberg, for the most part, would be data, and I could just as easily consume it, either in writing or (far less likely) video whenever I wanted.

I find that I make these data vs. experience decisions regularly. And some of them are changing. Baseball, for example. I usually consume it as a data stream, following pitches on my phone or computer as I talk to my wife (she doesn’t like it), watch TV or barbecue a fish. The experience of conversation is often reduced to data, with text messages as the most basic. Of course, since my business involves selling pages and pages of data, I shouldn’t put it down. But the information that comes in from our body, through experience, is the richest of our data channels–especially on a sunny day in Paris.

I walked back from the museum up these steps from the Seine
More Read

Image
Where in the World Does All this ESRI World Data Come from?
Proctor & Gamble – A Case Study in Business Analytics
Predictive Analytic Strategies to Out-Predict the Competition
Tips for Change Leaders – How to Show Your Impact
Building an Analytical Portal to Support Analytical Culture

And saw this bird in the Tuilerie Gardens.

I’m flying down to Madrid this morning and will be biking for the next week, from Leon to Santiago de Compostela, with an old friend.


Share This Article
Facebook Pinterest LinkedIn
Share

Follow us on Facebook

Latest News

Analyst points at colorful circular data dashboard on screen - information technology business metrics
How Fragmented Workplace Tech Undermines Reliable Business Metrics and Reporting
Cloud Computing Exclusive Infographic IT
Using Multi-Source Data and Analytics to Detect Operational Drift Across Franchise Networks -- AI-generated illustration
Using Multi-Source Data and Analytics to Detect Operational Drift Across Franchise Networks
Exclusive Infographic
Beyond The First Impression: The Long-Lasting Impact Of Sensory Marketing -- AI-generated illustration
Beyond The First Impression: The Long-Lasting Impact Of Sensory Marketing
Infographic Marketing
The Infrastructure Gap Slowing Data Center Growth -- AI-generated illustration
The Infrastructure Gap Slowing Data Center Growth
Big Data Cloud Computing Exclusive Infographic IT

Stay Connected

1.2KFollowersLike
33.7KFollowersFollow
222FollowersPin

You Might also Like

Apache Spark Use Cases
Data Mining

Apache Spark Use Cases

6 Min Read
Tweets Per Day Analysis
AnalyticsData VisualizationSocial Data

Tweets Per Day Analysis

2 Min Read
Top 5 Data Science Masters Programs
CommentaryJobsText Analytics

Top 5 Data Science Masters Programs

6 Min Read
Planning for the turned-around economy?  Cloud Computing and SaaS can help.
Cloud ComputingDecision ManagementKnowledge ManagementOpen Source

Planning for the turned-around economy? Cloud Computing and SaaS can help.

4 Min Read

SmartData Collective is one of the largest & trusted community covering technical content about Big Data, BI, Cloud, Analytics, Artificial Intelligence, IoT & more.

Chatbots and SEO: How Can Chatbots Improve Your SEO Ranking?
Artificial Intelligence Chatbots Exclusive
How To Get An Award Winning Giveaway Bot
Big Data Chatbots Exclusive

Quick Link

  • About
  • Contact
  • Privacy
Follow US
© 2008-26 SmartData Collective. All Rights Reserved.
Welcome Back!

Sign in to your account

Username or Email Address
Password

Lost your password?