While on a path recently to analyze curriculum elements at my college I discovered simple, free software – PAleontological STatistics (PAST) – that turned out to be well suited to the centerpiece of my endeavor. A surprise for me was that – though the software was clearly intended for fossil analysis – as an educator I was able to successfully “ride its coat-tails”!
Background
My holistic methodology was derived from that used by an architect, theorist, writer, and teacher Christopher W. Alexander (now retired to England) and by Charles L. Owen (design planner, skilled programmer, teacher, and an acquaintance of mine, now retired in Illinois). It took me a couple hours to complete my effort start to finish; this included a little bit of image processing of “screen captures” using Adobe Photoshop along with one page of some dense writing at a “closure” stage.
Front matter

A committee at my college generated some “high-order” learning competencies that we aim at undergraduates in our entrepreneurial studies program.
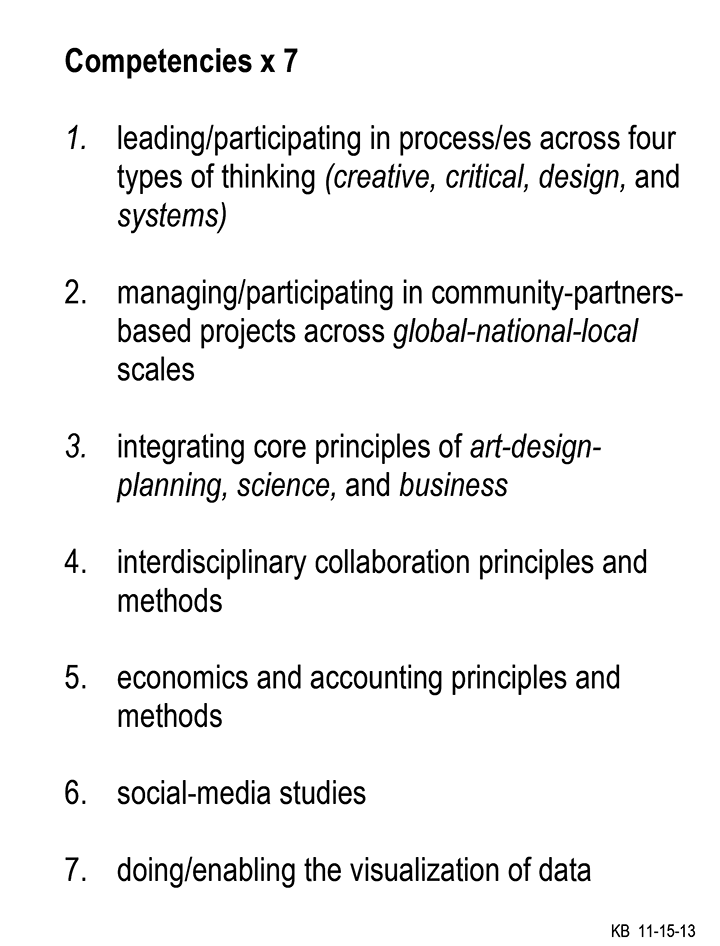
After numbering the resulting competencies (1-7) I set them into a symmetrical interaction matrix. I scored each cell of paired elements as strongly related (value of 2), slightly related (1) or seemingly unrelated (0):
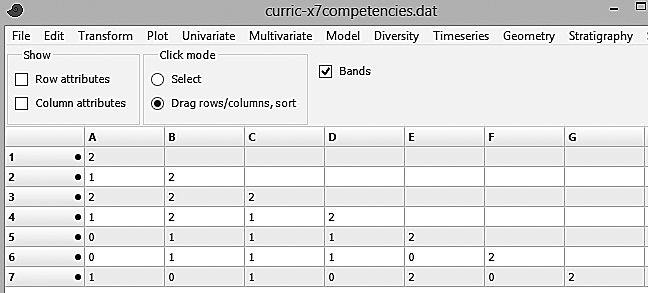
Statistical analysis
Back in the 1970s Professors Alexander and Owen each developed his own respective use of cluster analysis of design “problem elements”; from a design “systems” perspective their efforts were ground-breaking at the time since they could be applied to very large problem spaces. (My own elements were few in number and weren’t even describable as problems, rather, as I indicated earlier, they were “academic competencies”; but the basic challenge seemed the same.) I located the appropriate menu selection in PAST and ran my matrix through its hierarchical clustering routine. Appropriate algorithms could be selected beforehand – I chose Ward’s minimum variance method but there exist textbooks on the subject so I’ll forego details here. I do think Alexander and Owen preferred this approach in part because their final result could be effectively visualized as a semi-lattice diagram which looks like this:
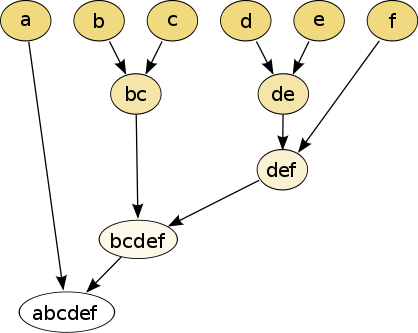
The above datagraphic isn’t pretty but it is compact and its structure is easily comprehended by students, colleagues, and clients. (It is from Wikipedia and seems derived from “dummy data” for educational purposes.) My own semi-lattice diagram – the real one calculated from my matrix using PAST and then screen captured – is here:
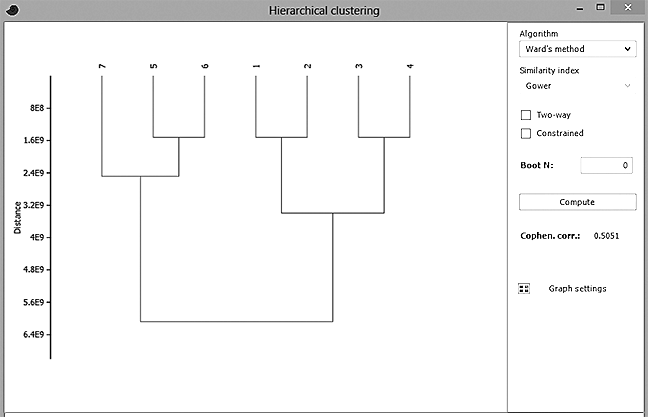
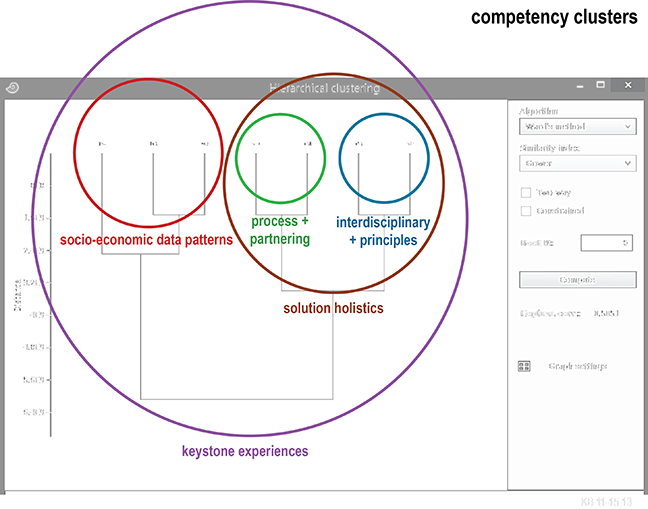
During my grad-school statistics coursework I recall learning that hierarchical clustering was a kind of “venn” of multivariate analysis, factor analysis, and data mining, so my next step was to identify “yet-to-be labeled” factors of elements that are judged as numerically linked and/or spatially contiguous. Smart Data Collective readers will know that “factors” an analyst is pursuing cannot be named “in advance” so I labeled them once results were revealed by the diagram. My objective was to establish a way for our committee to better understand curriculum elements as a pattern (using “education-speak” my elements were “learning outcomes”) for use by current and future students and faculty in our program. In their heyday Alexander and Owen would produce dozens, sometimes more; Professor Alexander came up with a cover term – a pattern language – and published a book on the subject, a bible-like best seller. That said, for my pattern I came up with a mere five in number, enclosed each by a colored circle, and named them as best I could:
Closure
Next it made sense to determine on this pattern map where another set of elements was positioned, i.e., the current courses we teach (and other key curriculum components). Cluster names from the previous figure were removed to avoid clutter and then replaced with new labels – of our courses and other matter (for example, “town halls” that happen twice a month in our program):

From time to time “higher education accreditors” want academic program leaders to show exactly how competencies (i.e., “learning outcomes”) are made manifest in the courses we teach. I expressed that as shown below – by way of one “sample-page” – written as narrative with a support photo is below. (Once again “ed-speak” textbooks/web-url’s abound on how this can be done, so details are absent here.)

This stage was a terminus for my two-hour effort, though more needs to be said and done (but not necessarily for my narrative matter here). As our committee has been on hiatus we’ll see what’s really next.
Caveats and conclusions
Use of data is “smart” if analyses are done at the right stage and/or place. In my case my statistical analysis was the meaty part of a kind of “process sandwich.” In hindsight I probably could have set aside time for tweaking here and there; for example, I recall learning from Charles Owen that it is best to have a members of an entire workgroup (in our case our committee) “independently” score an interaction matrix and later use the “aggregated data” for the final cluster analysis. Though my analysis was done with paleontological software hopefully that didn’t “fossilize” my college’s future curriculum plans.
Lastly, Smart Data Collective readers will have observed that the second decade of our new millennium is evolving nicely as a “free and open-source” one, so thanks are to be offered to Dr. Øyvind Hammer (the developer of PAST) and others, such as folks at D3 (as part of their data visualization library they offer a cluster layout tool using JavaScript). Readers’ observations, refinements, or corrections all welcomed in the “comments” section below.