Running Big Data in the cloud helps you scale and offer analytic capabilities to your users on an anytime, anywhere basis. You can quickly increase capacity to deal with the exploding scope and volume of data. Not only that, cloud computing helps you offload costly infrastructure and data management overheads so that you can focus on your core business. For teams already running these workloads in the cloud, the next decision is how to build the analytical platform around them.
However, just moving your Big Data to the cloud is not enough. To get real business benefits, you need build your big data analytics cloud platform such that it can provide insights to your business users as soon as they need them. And, for that you need to build a high-performing analytical environment that can handle huge volumes of data in the cloud, and deliver insights that are quick, reliable, and easily accessible.
Key Takeaway (Direct Answer): A high-performing cloud data analytics platform separates raw storage from the BI tools people actually use by adding a shared consumption layer, adopts an open table format like Apache Iceberg so no single engine locks in your data, and tests streaming ingestion and query concurrency before they cause a live dashboard failure.
Key Considerations for Success
There are several tools and technologies available today for cloud analytics and it is extremely important to choose a solution that can meet your organization’s growing requirements. Here is a list of parameters on which you should assess the available options before you make your choice.
Speed to Insights
Speed at which insights are delivered on Big Data is very important in shaping the success of your data initiatives. Since most analytic platforms slow down when the size of data increases, it is important to build an environment that delivers instant insights.
Interactive Analysis on Big Data
Business users must be able to query massive volumes of data, ask any question, and get results in seconds. They should be able to slice and dice, roll up and down, and explore their data interactively so that they can get meaningful insights from it.
Ease of Use
Dependency on IT teams and data analysts to pull reports from Big Data makes it difficult for users to utilize their data for business decision-making. The analytical platform should enable self-service Big Data access to users across the organization.
Elasticity
As cloud provides native elasticity features, the analytical platform should also be able to scale up and down to use the elasticity of the cloud. This will help you manage costs and scale quickly to meet changing requirements.
Build your Big Data Analytics Cloud Platform: An Approach
If you want to build a high-performing Big Data Analytics platform in the cloud, start with assessing the expectations of the business users. Identify who all need access to the data, how quickly do they expect their insights, and what tools do they prefer to use for analytics. Most business users would rather use their existing tools such as Qlik, Tableau, Power BI, Excel, or others, instead of going through the pains of learning new technologies and adopting new tools. In fact, it would be ideal if they can access Big Data without worrying about its size or location.

However, most analytical tools that perform well on smaller datasets slow down while handling Big Data. If you try to connect your analytical tools directly to massive data in the cloud, response times can go exceptionally high making analytics difficult.
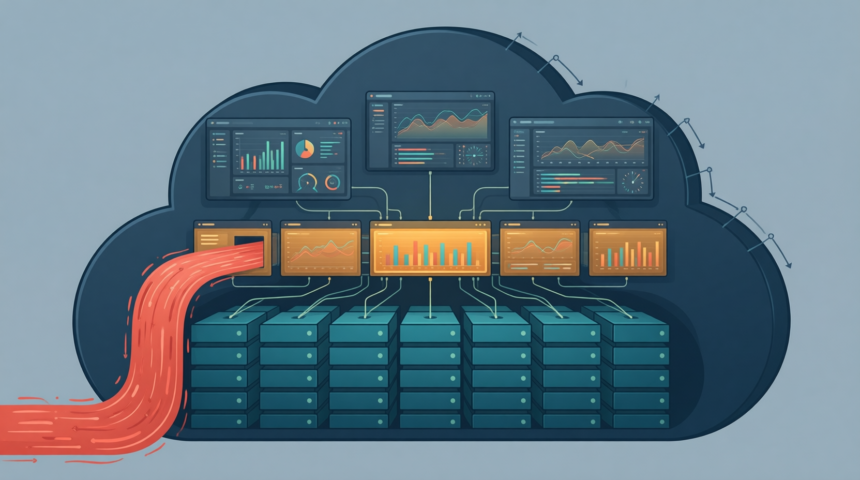
This can be resolved by building an enterprise BI Consumption layer on your Big Data platform that enables your analytical tools to access to massive volumes of data instantly. The main purpose of this layer is to bridge the gap between your analytical tools and Big Data. It resides in the cloud and can easily scale up and down to meet varying analytical loads. Once this layer is in place, users can use any tool they like for Big Data analytics and as a result, adoption is high. This approach helps you build a Big Data Analytics platform that delivers analytics in cloud with high performance, unlimited scalability, and rapid elasticity.
Teams that skip the BI consumption layer end up rebuilding the same connector work inside every analytics tool they adopt. Build it once, and the tool choice stops being a data-access decision.
Open Lakehouse with Apache Iceberg vs. Proprietary Cloud Data Warehouse
An open lakehouse keeps tables on object storage while allowing your team to choose the compute engine that queries them. For a cloud analytics solution serving several tools, the deciding trade-off is whether you need that engine choice enough to manage compatibility across the table format, catalog, and readers.
Apache Iceberg combines warehouse reliability with data lake flexibility in a vendor-neutral architecture. Iceberg and Delta Lake put the table format decision below the BI consumption layer, rather than tying every report to one engine’s storage. DuckDB and open table formats offer another route to a composable analytics stack on affordable cloud storage. Before changing engines, test whether your existing reports return the same results against the same table snapshot. Review the storage architecture choices alongside the query layer, particularly when readers and stored data will sit in different locations.
Apache Iceberg’s large and diverse ecosystem of contributors and products made it a clear choice for us to provide an open and common data layer across our internal and external ecosystem
Thomas Davey, Chief Data Officer of Booking.com, in Open Storage with Iceberg Tables Now Generally Available, Snowflake| Architecture pattern | Workload fit | Storage and compute choice | Checkpoint before adoption |
|---|---|---|---|
| Proprietary cloud data warehouse | BI reporting within a managed warehouse | Use the warehouse’s supported storage and execution model | Test report migration and data export requirements |
| Open lakehouse with Apache Iceberg | Analytics requiring vendor-neutral tables | Object storage with compatible query engines | Check catalog access and read/write compatibility |
| Open lakehouse with Delta Lake | Analytics using Delta-format tables | Object storage with engines supporting the required table features | Test every reader against the features your writers enable |
| DuckDB with open table formats | Composable analytics on cloud storage | DuckDB as a query component over supported tables | Benchmark representative data sizes and simultaneous queries |
Keep Reports Current with Streaming Ingestion
Streaming ingestion belongs alongside the BI consumption layer when users need changes before the next scheduled batch completes. Your cloud data analytics platform architecture should connect source changes to queryable tables, with the acceptable delay measured through to the report, not just to the ingestion service.
Change data capture (CDC), Kafka, and Flink are options for that path. Data streaming trends covering Kafka and Flink describe real-time analytics moving into the stream, with diskless Kafka and Apache Iceberg changing storage design. Qlik’s Open Lakehouse ingestion benchmark reports 77-88% lower costs and up to five times fresher data compared with leading cloud data warehouses. Those vendor-reported results make ingestion cost and freshness useful test criteria. Replay representative updates through your own pipeline, including deletes and a restart, and compare the resulting table with the source before connecting business reports.
Test Query Queuing Before the Dashboard Rush
Cloud analytics concurrency bottlenecks and query queuing need testing with simultaneous dashboard refreshes, not just a single fast query. Databricks describes high-concurrency, low-latency warehousing for BI reporting, but your acceptance test should record queue wait separately from execution time. Run your team’s usual reports together while ingestion continues. Include a query missing its date filter. Check whether it delays unrelated dashboards, then test queue limits and cached results against the same load. Confirm that faster cached reports still meet the freshness requirement agreed with business users.
Testing discipline is not a formality here. A DORA-backed analysis of DataOps practices found teams that test pipeline changes before release deploy updates five times faster and cut failure rates by 60% compared with teams that skip that step. Treat a query-queuing change the same way: test it before it reaches a live dashboard, not after a business user reports a stall.
Summary: Moving big data to the cloud is a major initiative that requires an investment in people, architecture, and processes. Building an end-to-end platform that combines raw object storage, open table formats like Apache Iceberg, and a dedicated BI consumption layer ensures analytical adoption thrives across the business without vendor lock-in or dashboard concurrency bottlenecks.
Frequently Asked Questions
What are the best cloud platforms for data analytics?
It depends on the workload. A proprietary cloud data warehouse fits BI reporting inside one managed platform with less setup. An open lakehouse using Apache Iceberg or Delta Lake fits analytics that need vendor-neutral, portable tables you can query with more than one engine. DuckDB over open table formats fits composable analytics on affordable cloud storage. Match the choice to your concurrency and cost requirements. Picking the most popular option by default usually costs you later.
Why use an open table format instead of a proprietary warehouse?
An open table format keeps your data in a shared format like Apache Iceberg or Delta Lake on object storage, instead of locked inside one engine’s proprietary storage. That lets you change query engines later without re-exporting everything. The trade-off is that you take on catalog access and read/write compatibility checks yourself; the warehouse vendor no longer handles them for you.
How do you test whether a cloud analytics platform can handle concurrent dashboard use?
Run your team’s usual reports together while ingestion continues, and include one query that is missing its date filter. Check whether it delays unrelated dashboards, then test your queue limits and cached results against that same load. Confirm the faster, cached reports still meet the freshness requirement your business users agreed to.