
We use cookies, including third-party cookies from Google to serve personalized ads through AdSense, to operate this site and understand how it is used. By continuing to browse, you accept this use. See our Privacy Policy and Terms of Use for details, including how to opt out of personalized advertising.
Accept
SmartData CollectiveSmartData Collective
  • Analytics
    AnalyticsShow More
    Flat editorial illustration: The article connects AI and marketing analytics with managerial judgment grounded in consumer behavi
    How an Online MBA in Marketing Connects AI and Data Analytics
    11 Min Read
    What Kind of Problem-Solving Distinguishes Data Analysts From Software Engineers -- AI-generated illustration
    What Kind of Problem-Solving Distinguishes Data Analysts From Software Engineers
    7 Min Read
    chatgpt image jul 21, 2026, 04 34 30 pm
    4 Core Benefits of Predictive Maintenance after Vibration Analysis
    10 Min Read
    How Does Data Mining Boost Customer Satisfaction in Logistics? Harnessing Analytics for Results -- AI-generated illustration
    How Does Data Mining Boost Customer Satisfaction in Logistics? Harnessing Analytics for Results
    11 Min Read
    chatgpt image jul 13, 2026, 04 23 45 pm
    How Data Analytics Helps Companies Improve User Engagement
    19 Min Read
  • Big Data
  • BI
  • Exclusive
  • IT
  • Marketing
  • Software
Search
© 2008-25 SmartData Collective. All Rights Reserved.
Reading: A Big Data Infographic: Wikibon offers tips on how you can tame the “Big Data Beast”
Share
Notification
Font ResizerAa
SmartData CollectiveSmartData Collective
Font ResizerAa
Search
  • About
  • Help
  • Privacy
Follow US
© 2008-23 SmartData Collective. All Rights Reserved.
SmartData Collective > Big Data > A Big Data Infographic: Wikibon offers tips on how you can tame the “Big Data Beast”
Big Data

A Big Data Infographic: Wikibon offers tips on how you can tame the “Big Data Beast”

BobGourley
BobGourley
1 Min Read
A Big Data Infographic: Wikibon offers tips on how you can tame the “Big Data Beast”
Illustration generated with FLUX.2 [Klein 9B] via local ComfyUI.
SHARE

You dear readers are some of the most informed technologists on the planent. I think few things surprise you about Big Data.  But many of us studying this concept are in a continual search for ways to explain key issues to non technologists, and that can be hard to do at times.

Masters at expression at Wikibon have done us all a favor by producing a terrific infographic that captures some of the important aspects of Big Data in clear and easy to understand ways.

You dear readers are some of the most informed technologists on the planent. I think few things surprise you about Big Data.  But many of us studying this concept are in a continual search for ways to explain key issues to non technologists, and that can be hard to do at times.

Masters at expression at Wikibon have done us all a favor by producing a terrific infographic that captures some of the important aspects of Big Data in clear and easy to understand ways.

More Read

Think Mid Data, and Triangulate: Tom H.C. Anderson on Next Generation Research Methods
Data Analytics Helps TikTok Marketers Boost Reach
Machine Learning Interview Questions to Land the Perfect Data Science Job
Free BI for Higher Ed
4 Ways Your Marketing Team Can Harness Big Data to 10X Productivity

Their infographic is embedded below:
Taming
Via: Wikibon Big Data

This post by BobGourley was first published at CTOvision.com.
Share This Article
Facebook Pinterest LinkedIn
Share

Follow us on Facebook

Latest News

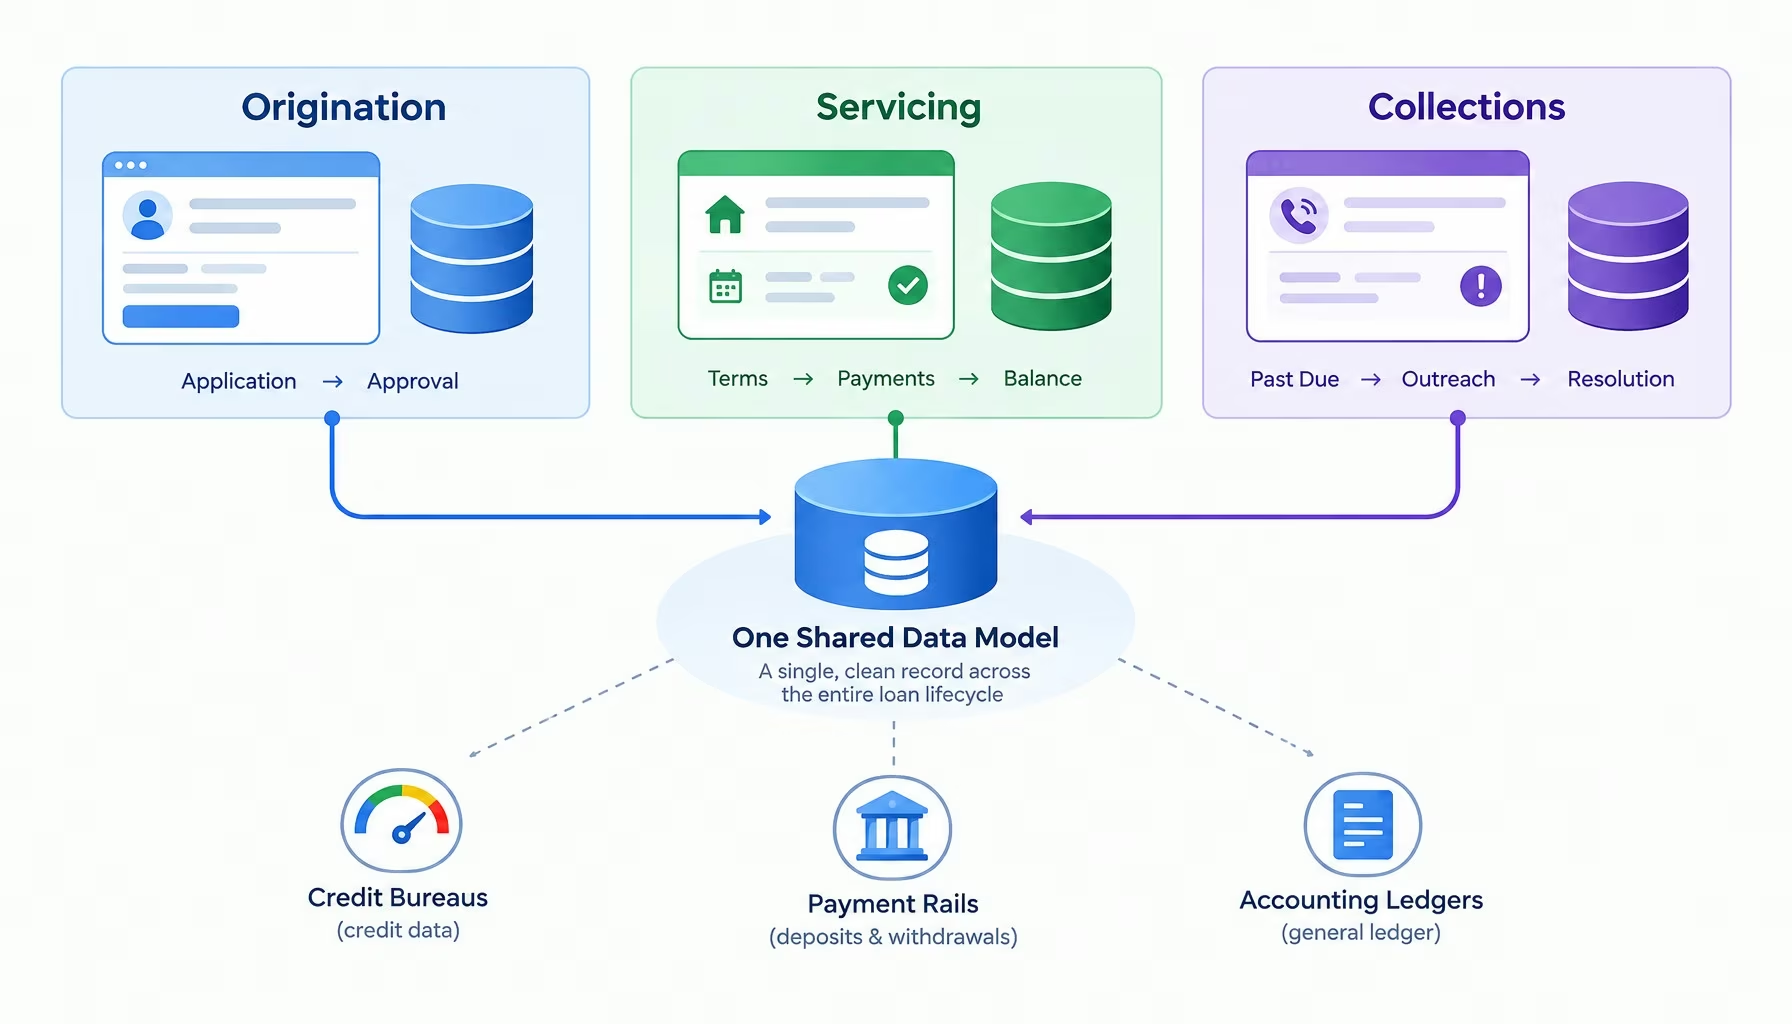
Flat editorial illustration: A technology-editorial comparison of disconnected origination, servicing, and collections records dr
The Data Reconciliation Problem Inside Disconnected Lending Systems
Big Data Exclusive Fintech
Flat editorial illustration: The article connects AI and marketing analytics with managerial judgment grounded in consumer behavi
How an Online MBA in Marketing Connects AI and Data Analytics
Analytics Artificial Intelligence Big Data Exclusive
Flat editorial illustration: The article connects commercial drone capture with integrated software workflows that organize and r
Drone Technology as a Business Investment: Calculating ROI, Costs, and Long-Term Value
Business Intelligence Marketing Software
Flat editorial illustration: The article connects weekly technician productivity and related shop metrics to timely scheduling an
Workforce Analytics for Auto Repair Shops: Reading Technician Productivity Weekly
Business Intelligence Exclusive

Stay Connected

1.2KFollowersLike
33.7KFollowersFollow
222FollowersPin

You Might also Like

Hospital Data
Big DataData ManagementITSecurity

Report: Protecting Hospital Data is becoming More Challenging

6 Min Read
The Joy of Stats: 200 Countries, 200 Years, 4 Minutes
AnalyticsData Visualization

The Joy of Stats: 200 Countries, 200 Years, 4 Minutes

3 Min Read
4 Ways to Leverage Data to Help Grow Your Business
Big Data

4 Ways to Leverage Data to Help Grow Your Business

8 Min Read
Design a Successful Business Dashboard: 3 Essential Tips
Best PracticesBusiness IntelligenceData MiningData VisualizationDecision Management

Design a Successful Business Dashboard: 3 Essential Tips

6 Min Read

SmartData Collective is one of the largest & trusted community covering technical content about Big Data, BI, Cloud, Analytics, Artificial Intelligence, IoT & more.

5 Great Tips for Using Data Analytics for Website UX
Big Data
From Bolts to Bots: How AI Is Fortifying the Automotive Industry
Artificial Intelligence

Quick Link

  • About
  • Contact
  • Privacy
Follow US
© 2008-26 SmartData Collective. All Rights Reserved.
Welcome Back!

Sign in to your account

Username or Email Address
Password

Lost your password?