
We use cookies, including third-party cookies from Google to serve personalized ads through AdSense, to operate this site and understand how it is used. By continuing to browse, you accept this use. See our Privacy Policy and Terms of Use for details, including how to opt out of personalized advertising.
Accept
SmartData CollectiveSmartData Collective
  • Analytics
    AnalyticsShow More
    What Kind of Problem-Solving Distinguishes Data Analysts From Software Engineers -- AI-generated illustration
    What Kind of Problem-Solving Distinguishes Data Analysts From Software Engineers
    7 Min Read
    chatgpt image jul 21, 2026, 04 34 30 pm
    4 Core Benefits of Predictive Maintenance after Vibration Analysis
    10 Min Read
    How Does Data Mining Boost Customer Satisfaction in Logistics? Harnessing Analytics for Results -- AI-generated illustration
    How Does Data Mining Boost Customer Satisfaction in Logistics? Harnessing Analytics for Results
    11 Min Read
    chatgpt image jul 13, 2026, 04 23 45 pm
    How Data Analytics Helps Companies Improve User Engagement
    19 Min Read
    chatgpt image jul 13, 2026, 03 59 46 pm
    How Data Analytics Improves Multi-Location Search Strategies
    10 Min Read
  • Big Data
  • BI
  • Exclusive
  • IT
  • Marketing
  • Software
Search
© 2008-25 SmartData Collective. All Rights Reserved.
Reading: Identifying Brand Loyal Customers with Clustering or Declining
Share
Notification
Font ResizerAa
SmartData CollectiveSmartData Collective
Font ResizerAa
Search
  • About
  • Help
  • Privacy
Follow US
© 2008-23 SmartData Collective. All Rights Reserved.
SmartData Collective > Business Intelligence > Identifying Brand Loyal Customers with Clustering or Declining
Business Intelligence

Identifying Brand Loyal Customers with Clustering or Declining

vincentg64
vincentg64
4 Min Read
Identifying Brand Loyal Customers with Clustering or Declining
Illustrative image generated with OpenAI gpt-image-1.
SHARE

It can be hard to discern where and how customer loyalty is forged, with so many external forces influencing customer sentiment like communication, retail merchandising and the right messaging. Clustering or Decile analysis may be used to segment customers based on their loyalty to a brand and identify those who have lost trust in it. Loyalty may be defined as the percentage of times that a customer purchases a certain brand of product compared to all brands in the same product category. A measure of brand loyalty may be required to gauge the response of buyers to a new campaign or other event in the marketplace. Performing a loyalty analysis requires a way of linking each transaction to the following: an identifiable customer with a loyalty card, website cookie, smart card, or other unique identifier.

As an example, let’s assume that a retailer sells a store brand of ice cream, ‘JELLO’, as well as two competitor brands named ‘PUDDING’ and ‘FUDGEO’, respectively. The store would like to evaluate customer loyalty to its JELLO brand after several thousand containers had to be recalled over a one-and-a-half month period. The retailer’s ‘BUYER’ loyalty card allows each ice cream purchase to be linked to a specific customer, and a random sample of customers has revealed the following:

– – the average customer purchases a container of ice cream once a week

– – time of year has no impact on whether a customer buys JELLO versus either PUDDING or FUDGEO brand of ice cream

More Read

Analytical Maturity Is Not Universal
How Business Intelligence is Making Real Estate Easier
Can AI Truly Write or Animate Great Anime?
Important Steps to Take to Address the Bias in AI
How Web Analytics Can Help Your Business

The above knowledge is important for determining how many periods of data are required to evaluate each customer’s loyalty to the JELLO brand. At least two months of data before, during and after the product recall took place is required for this analysis. For each customer, a ‘JELLO LOYALTY’ variable may be created for the three two-month periods: one for before, during and after the product recall. LOYALTY is calculated by dividing the number of times that a JELLO ice cream is purchased by the total number of ice cream purchases (JELLO, PUDDING and FUDGEO) for each two-month period. One final step is required before conducting a decile or clustering analysis: creating a ‘JELLO LOYALTY CHANGE’ variable for each customer. This variable captures the degree to which each store customer’s JELLO ice cream purchases is more, less or the same after the product recall.

Once the JELLO LOYALTY CHANGE variable is run through a clustering algorithm or decile analysis, loyal JELLO brand customers will be revealed. These are buyers who continue to purchase the same percentage of JELLO brand ice cream versus others after the product recall. Clustering may reveal an additional segment of customers who did change their behavior as a result of the JELLO product recall. They require attention from the marketing department in order to re-establish a trust in the JELLO brand. Other JELLO ice cream customers may have stopped buying during the product recall period but continued their previous purchasing pattern in the two months immediately after. This group should be treated the same as other groups from whom revenue was more permanently lost.


Share This Article
Facebook Pinterest LinkedIn
Share

Follow us on Facebook

Latest News

Flat editorial illustration: The article's core relationship is workload-by-workload decision-making for cloud migration, where s
Which Workloads Should Move to the Cloud?
Cloud Computing Exclusive IT
Flat editorial illustration: The article positions data governance as a strategic board-level concern rather than a purely techni
Why Data Governance Is Becoming a Board-Level Business Priority
Big Data Exclusive Policy and Governance
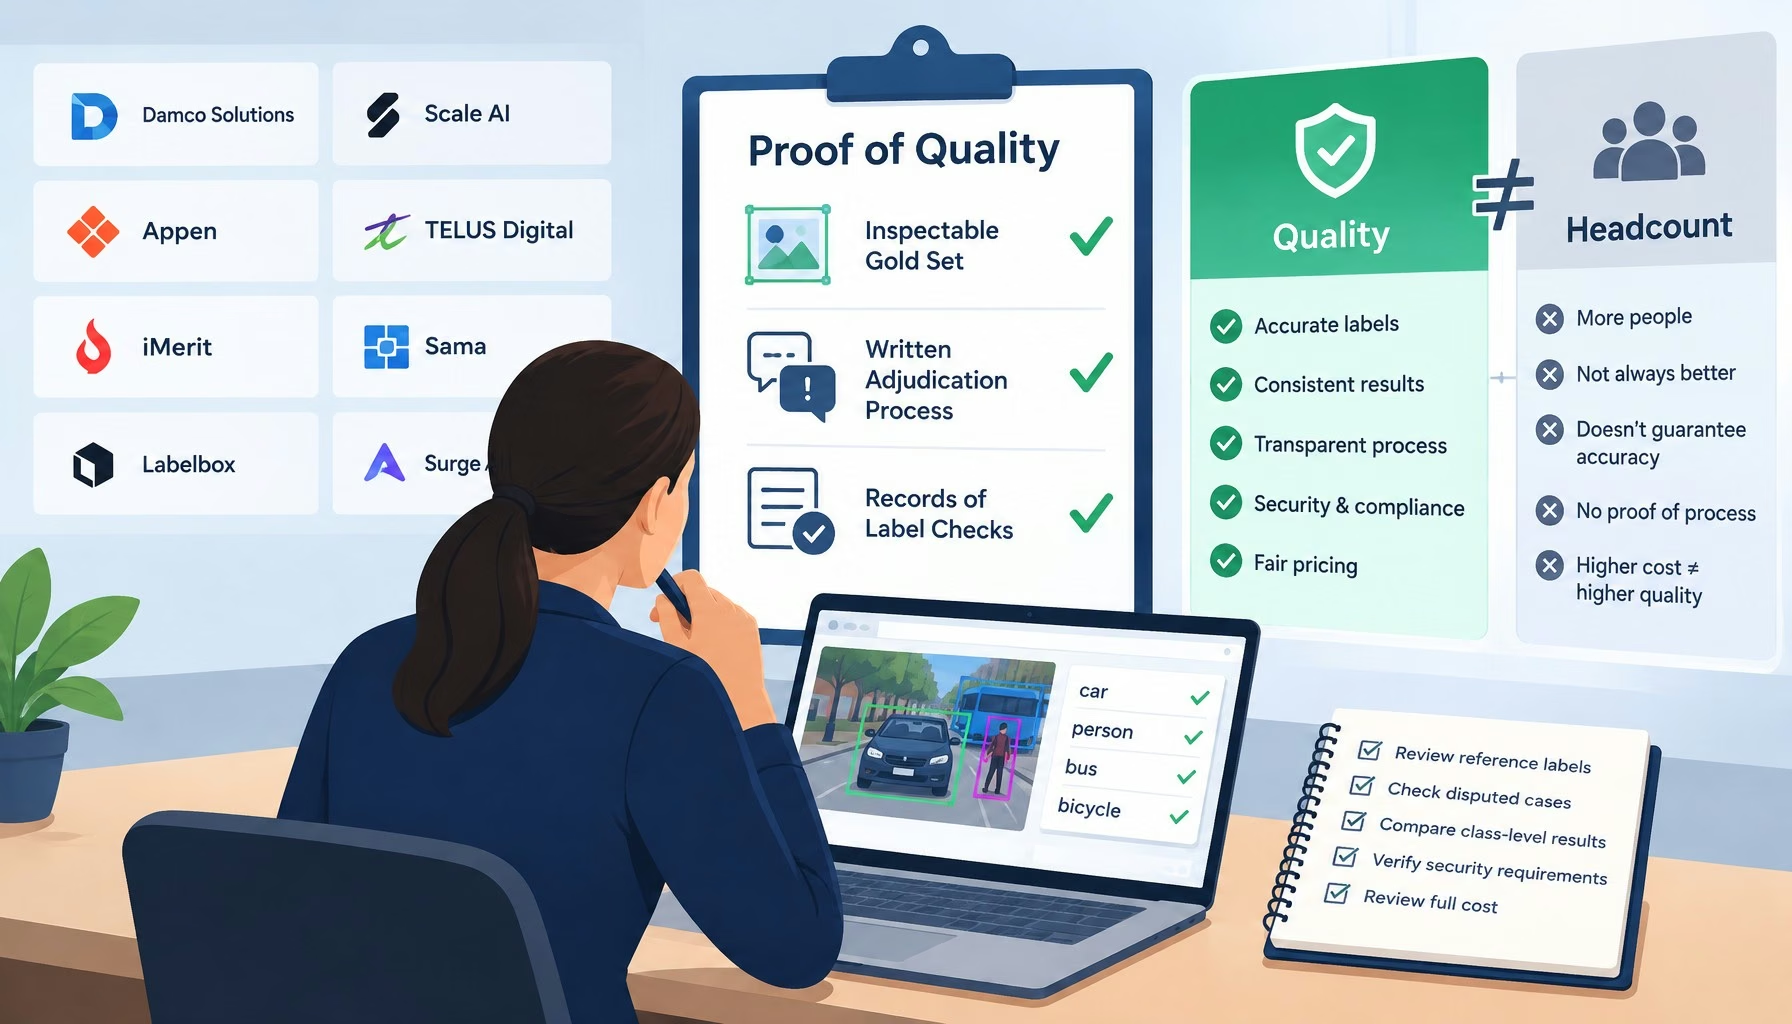
Flat editorial illustration: The article argues that data annotation quality should be measured by inspectable gold sets, written
The Top Data Annotation Companies Are Separated by Proof of Quality, Not Headcount
Big Data Exclusive
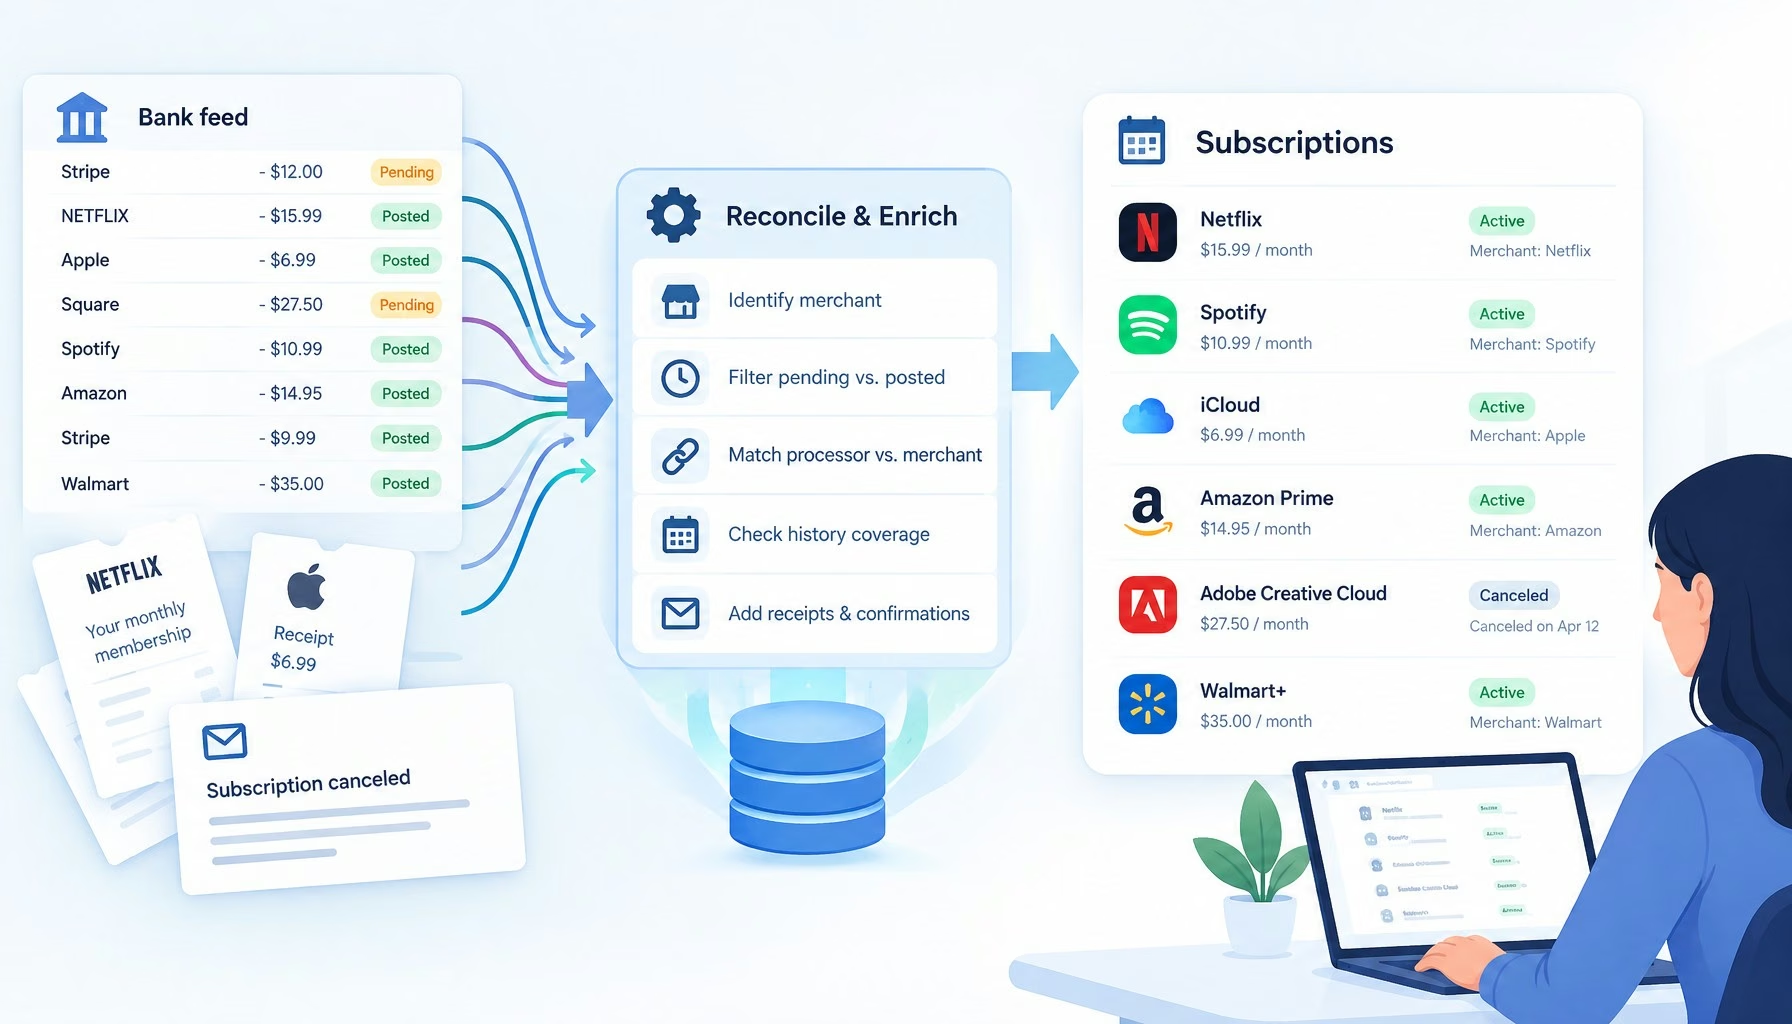
Flat editorial illustration: The article's core relationship is the gap between raw bank-feed records and reliable subscription i
Subscription Trackers Have a Transaction Data Problem
Big Data Exclusive

Stay Connected

1.2KFollowersLike
33.7KFollowersFollow
222FollowersPin

You Might also Like

How to Position Big Data
AnalyticsBusiness IntelligenceData ManagementData WarehousingITStatistics

How to Position Big Data

8 Min Read
AI-Driven SEO is Becoming Essential for Modern Marketing
Marketing

AI-Driven SEO is Becoming Essential for Modern Marketing

6 Min Read
Top 10 Excuses to Avoid Business Rules: #1 You want business users to do what?!
Best PracticesBusiness Rules

Top 10 Excuses to Avoid Business Rules: #1 You want business users to do what?!

5 Min Read
Amazon’s Data-Driven New Media Strategy: Bring Broadcast Ad Spend Online
Big DataBusiness Intelligence

Amazon’s Data-Driven New Media Strategy: Bring Broadcast Ad Spend Online

6 Min Read

SmartData Collective is one of the largest & trusted community covering technical content about Big Data, BI, Cloud, Analytics, Artificial Intelligence, IoT & more.

ai chatbot
How AI Website Chatbots Improve Customer Support and Lead Generation
Chatbots Exclusive
From Bolts to Bots: How AI Is Fortifying the Automotive Industry
Artificial Intelligence

Quick Link

  • About
  • Contact
  • Privacy
Follow US
© 2008-26 SmartData Collective. All Rights Reserved.
Welcome Back!

Sign in to your account

Username or Email Address
Password

Lost your password?