Cookies help us display personalized product recommendations and ensure you have great shopping experience.

By using this site, you agree to the Privacy Policy and Terms of Use.
Accept
SmartData CollectiveSmartData Collective
  • Analytics
    AnalyticsShow More
    image fx (67)
    Improving LinkedIn Ad Strategies with Data Analytics
    9 Min Read
    big data and remote work
    Data Helps Speech-Language Pathologists Deliver Better Results
    6 Min Read
    data driven insights
    How Data-Driven Insights Are Addressing Gaps in Patient Communication and Equity
    8 Min Read
    pexels pavel danilyuk 8112119
    Data Analytics Is Revolutionizing Medical Credentialing
    8 Min Read
    data and seo
    Maximize SEO Success with Powerful Data Analytics Insights
    8 Min Read
  • Big Data
  • BI
  • Exclusive
  • IT
  • Marketing
  • Software
Search
© 2008-25 SmartData Collective. All Rights Reserved.
Reading: Quick Visualization of irs.gov Search Queries
Share
Notification
Font ResizerAa
SmartData CollectiveSmartData Collective
Font ResizerAa
Search
  • About
  • Help
  • Privacy
Follow US
© 2008-23 SmartData Collective. All Rights Reserved.
SmartData Collective > Big Data > Data Mining > Quick Visualization of irs.gov Search Queries
Data MiningData VisualizationPredictive Analytics

Quick Visualization of irs.gov Search Queries

Editor SDC
Editor SDC
3 Min Read
SHARE

Here is a quick visualization I did in honor of April 15th to investigate what people looking for on tax day…
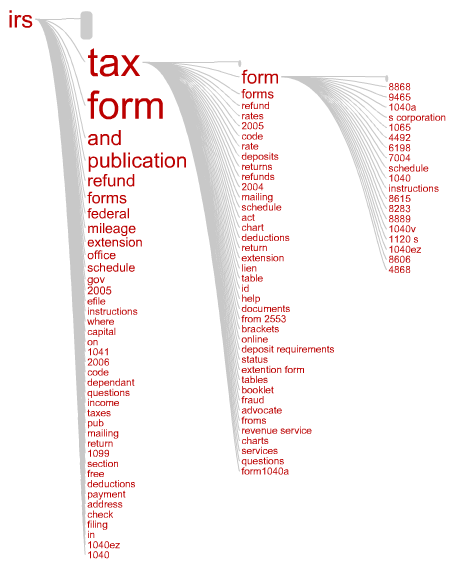
This “query tree” shows the most frequent searches starting with the term “irs”. Each branch in the tree represents a query where the words are sized according to frequency of occurrence. I like how you can see at a glance what the most popular tax forms are by following the “irs tax form …” branch.

It was created by uploading search queries from AOL users leading to clicks on irs.gov during Spring 2006 to Concentrate. This image is a snapshot of an interactive flash visualization, where the focus term was “irs”. Looking at query patterns like this can help you get an idea of what people are looking for and how to better organize your site so they can find it quickly.

More Read

Digital Reasoning’s Synthesys
Where in the World Does All this ESRI World Data Come from?
Feb 5th – WAA Webinar: Get the $$$ for Testing
Advantages of Artificial Intelligence in Virtual Worlds While we…
Because it’s Friday: Time Traveller Cheat-Sheet

The raw data is from the released AOL Search data sample, and consists of the subset of unique queries leading to clicks on irs.gov from March to May 2006. The IRS queries used to make the visualization can be downloaded here: irs.gov.queries.csv (191K)

Here are the top 10 queries in the file:

…

QuerySearches
irs4787
irs.gov2282

Here is a quick visualization I did in honor of April 15th to investigate what people looking for on tax day…

This “query tree” shows the most frequent searches starting with the term “irs”. Each branch in the tree represents a query where the words are sized according to frequency of occurrence. I like how you can see at a glance what the most popular tax forms are by following the “irs tax form …” branch.

It was created by uploading search queries from AOL users leading to clicks on irs.gov during Spring 2006 to Concentrate. This image is a snapshot of an interactive flash visualization, where the focus term was “irs”. Looking at query patterns like this can help you get an idea of what people are looking for and how to better organize your site so they can find it quickly.

The raw data is from the released AOL Search data sample, and consists of the subset of unique queries leading to clicks on irs.gov from March to May 2006. The IRS queries used to make the visualization can be downloaded here: irs.gov.queries.csv (191K)

Here are the top 10 queries in the file:

QuerySearches
irs4787
irs.gov2282
www.irs.gov1975
internal revenue service1154
irs forms608
tax forms361
irs tax forms196
internal revenue158
taxes142
wheres my refund139
federal tax forms125
irs refunds106

TAGGED:searchvisualization
Share This Article
Facebook Pinterest LinkedIn
Share

Follow us on Facebook

Latest News

image fx (2)
Monitoring Data Without Turning into Big Brother
Big Data Exclusive
image fx (71)
The Power of AI for Personalization in Email
Artificial Intelligence Exclusive Marketing
image fx (67)
Improving LinkedIn Ad Strategies with Data Analytics
Analytics Big Data Exclusive Software
big data and remote work
Data Helps Speech-Language Pathologists Deliver Better Results
Analytics Big Data Exclusive

Stay Connected

1.2kFollowersLike
33.7kFollowersFollow
222FollowersPin

You Might also Like

Entities, Relationships, and Semantics: Strata NY Panel on the State of Structured Search

1 Min Read

Got Hate Tweets?

1 Min Read

Modeling Visualization Macros

7 Min Read

More Than Pretty Pictures: Visualizing Insight

4 Min Read

SmartData Collective is one of the largest & trusted community covering technical content about Big Data, BI, Cloud, Analytics, Artificial Intelligence, IoT & more.

ai chatbot
The Art of Conversation: Enhancing Chatbots with Advanced AI Prompts
Chatbots
data-driven web design
5 Great Tips for Using Data Analytics for Website UX
Big Data

Quick Link

  • About
  • Contact
  • Privacy
Follow US
© 2008-25 SmartData Collective. All Rights Reserved.
Go to mobile version
Welcome Back!

Sign in to your account

Username or Email Address
Password

Lost your password?