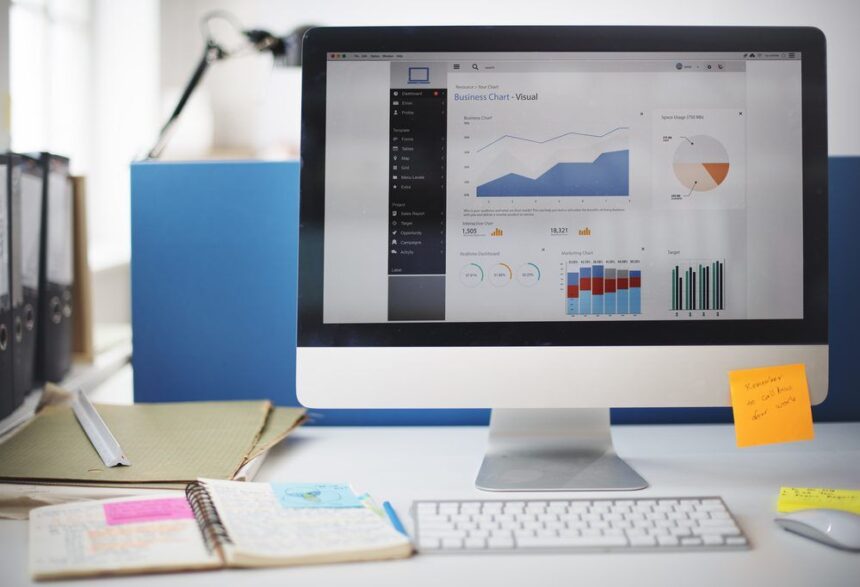
Real-time dashboards — the kind that show up on a big screen in a call center — are an entirely different beast than your standard management dashboard. Their job is to support immediate decision-making. As a result, the information must be easy to interpret, alert users to problems, and make the next action obvious. In addition to key success metrics, real-time dashboards may show detailed data about the action “on the ground.”
There are a lot of ways this technology can be employed. It can work with LED technology, which is one of the reasons ledscreenrentals.net is thriving. However, there are other benefits as well.
Here are eight characteristics that can make a real-time dashboard effective:
- A summary status that indicates how things stand overall. Users need to be able to tell at a glance whether they should worry or not. Here’s a great example from the folks at Superblock. The “Is it going to rain?” site tells you the single most important thing you need from a weather report.
- Reflect a well-understood structure of the business. By the time you design a real-time dashboard, you should have a strong theory for how the pieces of the business fit together (i.e. the relationships between key measures, drivers, and available actions). For example, in the call center business, there are clearly defined success measures (e.g. wait time), a mathematical relationship between these measures and their underlying drivers (e.g. call volume), and known levers to address problems (e.g. staffing levels).
- Support quick diagnosis of problems. The data presentation should point directly to the likely source of the problem. Real-time dashboards aren’t the place for deep analysis or introspection into the drivers of the business.
- Simple data presentation. In my view, real-time dashboards aren’t the place for complex or advanced data visualizations. Imagine you were Napoleon and you had to use a half-completed version of this chart to make a battlefield decision in the next 5 minutes.
- Granular view of the “unit of action.” Real-time dashboards are often about tracking activity. It may be useful to show the raw data around these events in the form of a ticker, scroll or RSS feed. We use at a real-time tracker for our website called Sitemeter. It does a nice job of tracking the basic unit of action — visitors.
- Appropriate time window. Getting time right on an operational dashboard is critical. If the measures and trends represent too long a time period, users may not react to changes quickly enough. On the other hand, very small-time windows encourage frantic reactions to changes that may not represent real trends. Ideally, the dashboard should offer the ability to configure this time range and “freeze” a moment in time.
- Prominent but balanced alerts. Naturally, alerting users to problems is a central mission for real-time dashboards. The challenge (as always with alerts) is to balance between “the sky is falling” hysteria and “don’t worry, be happy” apathy. I’ve written before about alerts, but one item to emphasize is the need to show a sense of relative importance. Not all problems have the same impact on the business, and finding a way to communicate this relative importance is valuable.
- Point to specific action. If real-time dashboards are about identifying and responding to issues, the tool should point users to what they can do about a problem. This can be as simple as displaying the phone number of the right person to call.
Real-time dashboards can be ignorable, create mayhem, or drive great behavior in an organization. Thinking carefully about the design and functionality will make a huge difference.


