Cookies help us display personalized product recommendations and ensure you have great shopping experience.

By using this site, you agree to the Privacy Policy and Terms of Use.
Accept
SmartData CollectiveSmartData Collective
  • Analytics
    AnalyticsShow More
    big data analytics in transporation
    Turning Data Into Decisions: How Analytics Improves Transportation Strategy
    3 Min Read
    sales and data analytics
    How Data Analytics Improves Lead Management and Sales Results
    9 Min Read
    data analytics and truck accident claims
    How Data Analytics Reduces Truck Accidents and Speeds Up Claims
    7 Min Read
    predictive analytics for interior designers
    Interior Designers Boost Profits with Predictive Analytics
    8 Min Read
    image fx (67)
    Improving LinkedIn Ad Strategies with Data Analytics
    9 Min Read
  • Big Data
  • BI
  • Exclusive
  • IT
  • Marketing
  • Software
Search
© 2008-25 SmartData Collective. All Rights Reserved.
Reading: Watch 131 Years of Global Warming in 26 Seconds | Climate…
Share
Notification
Font ResizerAa
SmartData CollectiveSmartData Collective
Font ResizerAa
Search
  • About
  • Help
  • Privacy
Follow US
© 2008-23 SmartData Collective. All Rights Reserved.
SmartData Collective > Big Data > Data Visualization > Watch 131 Years of Global Warming in 26 Seconds | Climate…
AnalyticsData Visualization

Watch 131 Years of Global Warming in 26 Seconds | Climate…

JackMason
JackMason
1 Min Read
SHARE

Watch 131 Years of Global Warming in 26 Seconds | Climate Central

Watch 131 Years of Global Warming in 26 Seconds | Climate Central

More Read

Two analysts’ stories
The Top 7 Data Analytics Tools for 2019
The 4 Es of Social Media Strategy
Report from Affecto Corporate IQ Oslo
“Big Data” Is Coming, “Big Data” Is Coming:

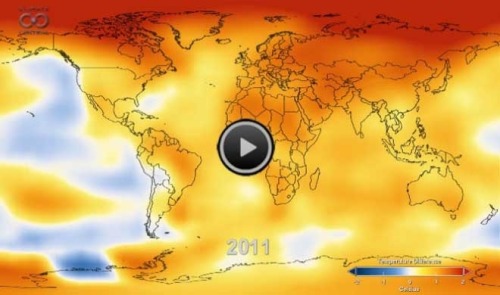
While temperatures have been blistering this summer, this video takes the longer historical view. It comes to us from our friends at NASA and is an amazing 26-second animation depicting how temperatures around the globe have warmed since 1880. That year is what scientists call the beginning of the “modern record.” You’ll note an acceleration of those temperatures in the late 1970s as greenhouse gas emissions from energy production increased worldwide and clean air laws reduced emissions of pollutants that had a cooling effect on the climate, and thus were masking some of the global warming signal. The data come from NASA’s Goddard Institute for Space Studies in New York, which monitors global surface temperatures. As NASA notes, “in this animation, reds indicate temperatures higher than the average during a baseline period of 1951-1980, while blues indicate lower temperatures than the baseline average.” 

TAGGED:global warming
Share This Article
Facebook Pinterest LinkedIn
Share

Follow us on Facebook

Latest News

AI role in medical industry
The Role Of AI In Transforming Medical Manufacturing
Artificial Intelligence Exclusive
b2b sales
Unseen Barriers: Identifying Bottlenecks In B2B Sales
Business Rules Exclusive Infographic
data intelligence in healthcare
How Data Is Powering Real-Time Intelligence in Health Systems
Big Data Exclusive
intersection of data
The Intersection of Data and Empathy in Modern Support Careers
Big Data Exclusive

Stay Connected

1.2kFollowersLike
33.7kFollowersFollow
222FollowersPin

You Might also Like

big data helping to save environment
Big DataExclusive

Can Big Data Help Save The Environment?

5 Min Read

SmartData Collective is one of the largest & trusted community covering technical content about Big Data, BI, Cloud, Analytics, Artificial Intelligence, IoT & more.

AI and chatbots
Chatbots and SEO: How Can Chatbots Improve Your SEO Ranking?
Artificial Intelligence Chatbots Exclusive
data-driven web design
5 Great Tips for Using Data Analytics for Website UX
Big Data

Quick Link

  • About
  • Contact
  • Privacy
Follow US
© 2008-25 SmartData Collective. All Rights Reserved.
Go to mobile version
Welcome Back!

Sign in to your account

Username or Email Address
Password

Lost your password?