


Union Pacific Railroad, the largest railroad company in the USA, has adopted big data in many aspects of its operations. For over 150 years the companies hauls coal, grain and manufactured goods in 23 states west of Chicago and New Orleans. It has over 44.000 employees, more than 8.000 locomotives and in total runs 31.900 route miles.
Union Pacific Railroad, the largest railroad company in the USA, has adopted big data in many aspects of its operations. For over 150 years the companies hauls coal, grain and manufactured goods in 23 states west of Chicago and New Orleans. It has over 44.000 employees, more than 8.000 locomotives and in total runs 31.900 route miles. It turned to big data to improve their operations from reducing train derailments, increased velocity of shipments to reduction of its emissions. Big data is all around at Union Pacific.
Using predictive analytics to reduce train derailments
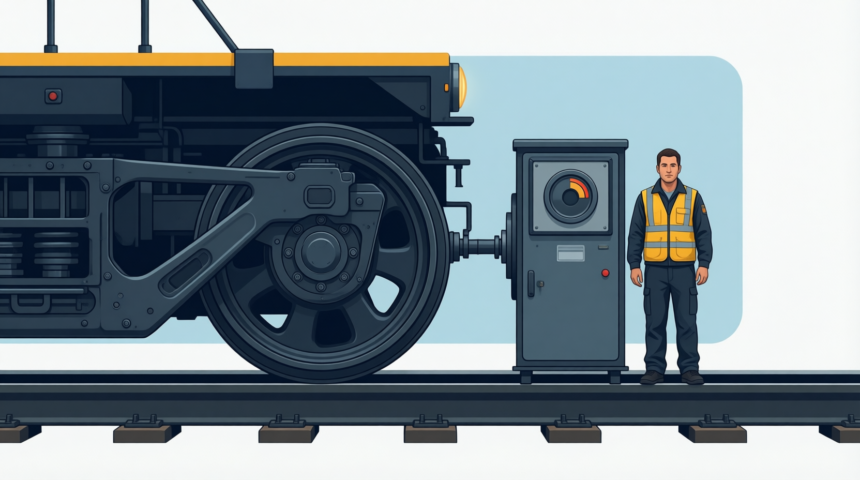
Predictive analytics help Union Pacific to predict certain derailments days or even weeks before they are likely to occur. Using thermometers, acoustic and visual sensors on the underside of each of its rail carriages they can detect and analyse imminent problems with tracks and wheels. In order for all the data to be transmitted over the vast rail system, they have deployed a fibre optic communications network throughout its rail system. Although a train derailment does not have to be a large accident, small errors can result in vast delays and with 3.350 trains operational on any given day this can become very expensive.
They already have acoustic sensors for over a decade on the trains. They were used to deliver noises from vibrations in train wheels to detect anomalies on the track. Now they started to use predictive analytics to find patterns in the captured noise that could indicate on wider potential problems. Recently they have also installed visual sensors that can shoot ultrasound visuals that can detect when wheels begin to flatten. These sensors have led to a reduction in bearing-related derailments by 75% – a noteworthy success since a major derailment can cost as much as $40 million.
More Read

Real-time analytics increase train shipments
There are many different aspects involved to deliver freight in such a vast area in the USA. Scheduling the crew on the right train in the right area and having them deliver the right freight to the right location in time. Many changes occur on a daily bases from unplanned maintenance, accidents, weather that affects the operations and as such schedule changes. Only with real-time data analytics, Union Pacific is able to stay on track.
As Martin Malley, Assistant Vice President of Information Systems, Union Pacific Railroad, explains in a TIBCO blog post: “the event-driven architecture is one of the most exciting things we´re doing in IT. With it, we can correlate raw events from multiple sources [a hot-bearing detector, a GPS reading] to derive filtered intelligence on the business event of a train location.”
Union Pacific uses a vast amount of different sensors to collect data that helps them increase train shipments to keep their customers happy; sensors in rails, switches, brakes, bearings, power plants or RFID in terminals and GPS units on trains in combination with weather data is used to ensure the safety of the trains. Data from employee clock-in and out is mapped against the actual schedule to see the effectiveness and efficiency of the schedule.
Big data leads to big emission reductions
Union Pacific had a carbon disclosure score of 98, out of a possible 100, and is in the top 10 percent of all companies in the Global 500. Not a bad achievement for a company that moves for example 260 million tons of coal annually. Union Pacific designs, builds and implements fuel- and emissions-reducing technologies in which big data plays a key role to analyse all the data that is created with the technologies. All that data needs to be stored and processed in data centres that normally require a lot of energy, but using the latest technology they were able to even reduce energy consumption. Although in recent years the computing capacity increased by 200% and the disk storage capacity by 700%, overall energy consumption in the data centres decreased by 14%. Overall Union Pacific Railroads were able to eliminate an estimated 33.5 million tons of greenhouse gases in 2012 using the latest technologies and data analytics.
The result of all the big data solutions in place is 20 million daily pattern matches performed on all the sensor data. These data readings generate around 1.500 alerts per day that need to be checked by Union Pacific’s mission control centre in Omaha. Chris Murphy, from Information Week, calls this centre “something of a cross between an air traffic control room and a stock exchange”. Of those 1.500 alerts, 50-60 can wait until the train reaches its final destination, 25-30 until the train reaches its next terminal and 7-10 alerts require immediate inspections by the train driver. In order be able to gather, process, store, analyse and visualize all data, Union Pacific has over 2.000 IT employees, who are constantly busy to make Union Pacific a smarter railroad, pushing the limits of the industrial internet.




