We use cookies, including third-party cookies from Google to serve personalized ads through AdSense, to operate this site and understand how it is used. By continuing to browse, you accept this use. See our Privacy Policy and Terms of Use for details, including how to opt out of personalized advertising.
Accept
SmartData CollectiveSmartData Collective
  • Analytics
    AnalyticsShow More
    chatgpt image jul 21, 2026, 04 34 30 pm
    4 Core Benefits of Predictive Maintenance after Vibration Analysis
    10 Min Read
    How Does Data Mining Boost Customer Satisfaction in Logistics? Harnessing Analytics for Results -- AI-generated illustration
    How Does Data Mining Boost Customer Satisfaction in Logistics? Harnessing Analytics for Results
    11 Min Read
    chatgpt image jul 13, 2026, 04 23 45 pm
    How Data Analytics Helps Companies Improve User Engagement
    19 Min Read
    chatgpt image jul 13, 2026, 03 59 46 pm
    How Data Analytics Improves Multi-Location Search Strategies
    10 Min Read
    cybersecurity efforts
    How Behavioral Analytics and AI Are Redefining Cybersecurity for Boca Raton Businesses
    14 Min Read
  • Big Data
  • BI
  • Exclusive
  • IT
  • Marketing
  • Software
Search
© 2008-25 SmartData Collective. All Rights Reserved.
Reading: Stat Models, Astronomical Mysteries…and Business Data
Share
Notification
Font ResizerAa
SmartData CollectiveSmartData Collective
Font ResizerAa
Search
  • About
  • Help
  • Privacy
Follow US
© 2008-23 SmartData Collective. All Rights Reserved.
SmartData Collective > Analytics > Stat Models, Astronomical Mysteries…and Business Data
AnalyticsBig DataBusiness IntelligenceStatistics

Stat Models, Astronomical Mysteries…and Business Data

vincentg64
vincentg64
4 Min Read
Stat Models, Astronomical Mysteries…and Business Data
Illustration generated with FLUX.2 [klein 4B] via Cloudflare Workers AI.
SHARE

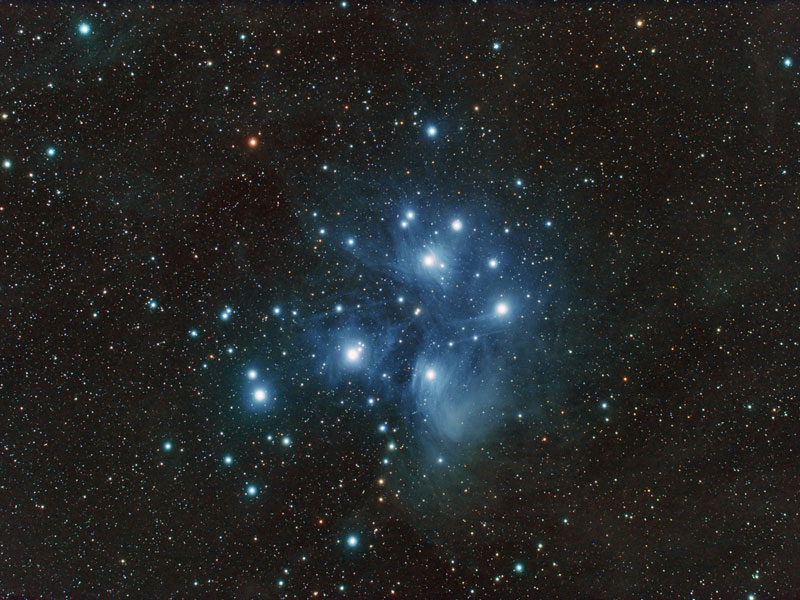
If you look at the picture below (Pleiades constellation), you will see – with the naked eye – that many star systems appear to be binary: that is, involving two (or more) stars orbiting around each other.

Is this a coincidence, or can we prove that from a statistical point of view, based on the theory of stochastic point processes, we are NOT dealing with a pure random process (Poisson process)? At first glance, as a statistician, I would say that the chance of observing so many pairs is extremely low, far below 0.000000001%. Now keep in mind that 2 stars that look very close to each other when viewed from Earth might actually be much more distant from each other than 2 stars that seem far apart, because we lack depth (the third dimension, or perspective) in these pictures. Also, most binary systems apparently consist of a normal star and a much smaller companion, thus we might see only a small fraction of all binary systems. In other words, maybe 90% of all solar systems are binary. Finally, there are cloudy areas in the picture below, where gas clouds hide stars located behind them.

The way to compute the probability to observe so many binary systems is as follows: 

  • Simulate one million realizations of a Poisson process on a rectangle (the size of the picture below), each with 300 points (I’m assuming there are about 300 relatively bright stars in the picture below; let’s ignore the dim stars as they are just adding noise).
  • Compute the number of stars where closest neighbor is less than 1.5 millimeter away, for each of the one million simulations. Average your computations.
  • If that average number is below x=5 as I would guess (or even if it is below x=20 for that matter), then clearly the Poisson assumption is violated since we observe at least x=50 bright binary stars in the picture, so we really are dealing with a star generation mechanism that favors binary over single stars.

Note that if you know elementary statistics and basic concepts about Poisson processes (the most basic of all stochastic processes), then you don’t even need to perform one million simulations. There is an exact mathematical formula that tells you the expected number of binary starts that you should see if binary stars were not favored: it is based on the Erlang distribution. Distances to nearest neighbors have extensively been studied in statistics; there is a solid theoretical background around it.

More Read

4 Key Ways to Turn Big Data Into Big Dollars [INFOGRAPHIC]
Five Ways Self-Service Data Prep Empowers Excel Users
Translating Artificial Intelligence: Learning to Speak Global Languages
The State of Complex Data in January 2016 [INFOGRAPHIC]
Big Data and the Big Opportunity to Reform Education

stat models business data

On a different topic, can we apply statistical principles used in astronomy, in the business world of big data?

I’m thinking of a measuring distance to far away stars as an example, where multiple measurements from a highly calibrated system are aggregated to refine the accuracy. In some ways, using multiple measurements to amplify a very weak signal. Can this concept of signal amplification be used to gain better, more accurate insights from big data? After all, business data is also very noisy and foggy: it also has its own clouds just as in the above picture, both metaphorically and physically, making statistical inference, pattern detection, and insights discoveries more difficult. 

Share This Article
Facebook Pinterest LinkedIn
Share

Follow us on Facebook

Latest News

Analyst points at colorful circular data dashboard on screen - information technology business metrics
How Fragmented Workplace Tech Undermines Reliable Business Metrics and Reporting
Cloud Computing Exclusive Infographic IT
Using Multi-Source Data and Analytics to Detect Operational Drift Across Franchise Networks -- AI-generated illustration
Using Multi-Source Data and Analytics to Detect Operational Drift Across Franchise Networks
Exclusive Infographic
Beyond The First Impression: The Long-Lasting Impact Of Sensory Marketing -- AI-generated illustration
Beyond The First Impression: The Long-Lasting Impact Of Sensory Marketing
Infographic Marketing
The Infrastructure Gap Slowing Data Center Growth -- AI-generated illustration
The Infrastructure Gap Slowing Data Center Growth
Big Data Cloud Computing Exclusive Infographic IT

Stay Connected

1.2KFollowersLike
33.7KFollowersFollow
222FollowersPin

You Might also Like

5 Things Every Company Should Do to Cover Their Assets
Data Quality

5 Things Every Company Should Do to Cover Their Assets

5 Min Read
Beyond the Bottomline: ERP Tools Are Meant for Ensuring Customer Satisfaction
CRM

Beyond the Bottomline: ERP Tools Are Meant for Ensuring Customer Satisfaction

7 Min Read
Without Things, There Is No Analytics Of Things (AoT)
AnalyticsBig Data

Without Things, There Is No Analytics Of Things (AoT)

8 Min Read
Data Warehouse “as a Service” – A Good Pick for Mid-Sized Companies
Cloud ComputingData Warehousing

Data Warehouse “as a Service” – A Good Pick for Mid-Sized Companies

6 Min Read

SmartData Collective is one of the largest & trusted community covering technical content about Big Data, BI, Cloud, Analytics, Artificial Intelligence, IoT & more.

From Bolts to Bots: How AI Is Fortifying the Automotive Industry
Artificial Intelligence
Chatbots and SEO: How Can Chatbots Improve Your SEO Ranking?
Artificial Intelligence Chatbots Exclusive

Quick Link

  • About
  • Contact
  • Privacy
Follow US
© 2008-26 SmartData Collective. All Rights Reserved.
Welcome Back!

Sign in to your account

Username or Email Address
Password

Lost your password?