
I’ve been using electronic spreadsheets for more than 30 years. I consider this technology among the 20th century’s top five most important advances in business management. Spreadsheets have revolutionized every aspect of running any organization. A spreadsheet (specifically, VisiCalc) was the original “killer app” that made business people feel the necessity to buy a personal computer.
I’ve been using electronic spreadsheets for more than 30 years. I consider this technology among the 20th century’s top five most important advances in business management. Spreadsheets have revolutionized every aspect of running any organization. A spreadsheet (specifically, VisiCalc) was the original “killer app” that made business people feel the necessity to buy a personal computer.
Yet, as enthusiastic as I am about spreadsheets, I know they have their limits. If you fail to respect those limits, you wind up paying for it, either in obvious ways, as JP Morgan did when faulty spreadsheets used by its trading desk cost it billions, or in less obvious ways, such as in multiple business mistakes that go unnoticed and uncounted, or by hours lost trying to make spreadsheets do things they were never designed for, or in valuable opportunities organizations cannot take advantage of because they run out of time dealing with basic issues imposed by spreadsheets.
The essential problem is the disconnect between what spreadsheets were originally designed to do and how they are actually being used in corporations. Spreadsheets were designed to be a personal productivity tool, good at prototyping models and analytics used in processes, performing one-off analyses using simple models and storing small amounts of data. But many people run into issues using spreadsheets for collaborative, repetitive, enterprise-wide tasks. More than half (58%) of participants in our research said that the most important spreadsheet they work with is used in just these sorts of efforts.

One of the most serious, longstanding, but mostly overlooked issues is that desktop spreadsheets are error-prone. One-third of our research participants say that errors in data occur in the spreadsheets they use for their most important process, and a quarter say there are errors in formulas. Errors in spreadsheets are common, and may remain even when they are checked and, indeed, audited. The consequences of these errors can be catastrophic. Yet few of our participants (even the most experienced and proficient users) said they do rigorous checking to ensure accuracy of the data; half do checking only when something doesn’t look right, and when they do check they look only at selected cells. This likely is another reason why most people see no impact on their productivity from problems in spreadsheets: They simply don’t spend a lot of time checking for errors. It also may explain why mistakes have a limited impact on businesses – even the selective eyeballing method of checking for accuracy is likely to spot many of the blatant mistakes that would have a significant impact on business.
Productivity is one of the important reasons why spreadsheets became popular – but when used improperly, spreadsheets sap productivity. Spreadsheets are seductive because people are familiar with them. They are easy to set up to do even moderately complex models, perform analyses and create reports. However, after more than a few people become involved and a spreadsheet file is used and reused, cracks begin to appear. Very quickly, a large percentage of the time spent with the file is devoted to finding the source of errors and discrepancies and fixing the mistakes. Our research confirms this. When it comes to important spreadsheets that people use over and over again to collaborate with colleagues, on average people spend about 12 hours per month consolidating, modifying and correcting the spreadsheets. That’s about a day and a half per month – or about 5-10 percent of their time – just maintaining these spreadsheets.
It’s fairly common for there to be multiple spreadsheets circulating around an organization that are supposed to be the same, but that are different versions with different numbers in them. Long ago, this phenomenon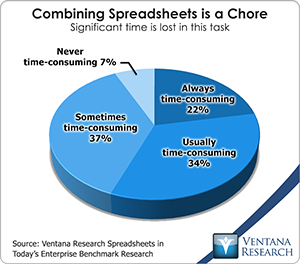 got its own term: dueling spreadsheets. It happens because the data in a desktop spreadsheet is not bound to a single source that everyone is working from. It may be a single source, but the data may be collected at different times. There may be changes to formulas or additions or deletions that take place, and not everyone is on the same version. This is what happens when spreadsheets are used in repetitive, collaborative enterprise processes. It’s a problem that is more common in larger companies than small; 44 percent of companies with 10,000 or more employees – very large companies – say that it happens frequently or all the time, which is about twice the rate reported by small or midsize businesses, and for companies between 1,000 and 10,000 employees the percentage is about one-third. It’s also more commonly experienced in finance departments – which requires absolute accuracy. Sometimes the differences between spreadsheets are not that important, or you can work around them. But time is wasted as our research found – more than half of organizations (56% always time-consuming and usually time-consuming) spend significant amount of time combining spreadsheets.
But in many other cases it’s important to not waste time trying to resolve whose spreadsheet is right – because they all could be wrong.
People routinely communicate the results of their data gathering and analysis using spreadsheet charts and graphs as visual aids. Most (64%) research participants – and 80 percent of those who spend more than three-fourths of their time working with spreadsheets – find it easy or very easy to create graphs and charts in spreadsheets. Yet while it’s easy enough to create them, organizations find that these graphs and charts do not satisfy their needs for visualizing information. Only one-fourth said that these graphical elements are all they need to communicate information effectively in visual form; another one-fourth said that these graphs and charts are suitable for only some of their work. While one-third of those in small or midsize organizations said spreadsheet visuals are enough, just 18 percent from large and very large organizations said spreadsheets are a suitable visual communications tool. People working in larger companies likely have higher expectations for the quality of presentations and other such material and may need to convey more complex information. We conclude that the charting and graphing capabilities included in desktop spreadsheets (notably Microsoft Excel) are not adequate for communicating data and insights.
Today businesses have many more options than ever before to embrace and extend spreadsheets – to have the best of both worlds. Many new, affordable software solutions complement spreadsheets and address their shortcomings. Many applications use Excel as an  interface – giving people a familiar look and feel while addressing key technological shortcomings of desktop spreadsheets that make them error-prone and difficult to consolidate or roll up. Spreadsheets are a leading reporting tool – critical for communicating results, forecasts, situations and risks. Yet even after all this time, when it comes to reporting, spreadsheets fall short because they can be time-consuming to update contain unseen errors and – even though it’s easy to create basic charts – they aren’t flexible or capable enough for even moderately sophisticated visual communications. Even with these drawbacks, people frequently choose to create reports themselves because the IT department takes too long to create and modify them: nearly half (46%) find this to be the case.
It’s important for senior executives to understand the limitations of spreadsheets and acknowledge their shortcomings. Spreadsheets are indispensible to any organization, but they must be used only for what they were designed for. It’s important not to abuse them and allow them to saddle your organization with hidden costs, risks, and poor or untimely decisions driven by spreadsheets.


