We use cookies, including third-party cookies from Google to serve personalized ads through AdSense, to operate this site and understand how it is used. By continuing to browse, you accept this use. See our Privacy Policy and Terms of Use for details, including how to opt out of personalized advertising.
Accept
SmartData CollectiveSmartData Collective
  • Analytics
    AnalyticsShow More
    chatgpt image jul 21, 2026, 04 34 30 pm
    4 Core Benefits of Predictive Maintenance after Vibration Analysis
    10 Min Read
    How Does Data Mining Boost Customer Satisfaction in Logistics? Harnessing Analytics for Results -- AI-generated illustration
    How Does Data Mining Boost Customer Satisfaction in Logistics? Harnessing Analytics for Results
    11 Min Read
    chatgpt image jul 13, 2026, 04 23 45 pm
    How Data Analytics Helps Companies Improve User Engagement
    19 Min Read
    chatgpt image jul 13, 2026, 03 59 46 pm
    How Data Analytics Improves Multi-Location Search Strategies
    10 Min Read
    cybersecurity efforts
    How Behavioral Analytics and AI Are Redefining Cybersecurity for Boca Raton Businesses
    14 Min Read
  • Big Data
  • BI
  • Exclusive
  • IT
  • Marketing
  • Software
Search
© 2008-25 SmartData Collective. All Rights Reserved.
Reading: Reinventing the Analytics Experience, Sideways
Share
Notification
Font ResizerAa
SmartData CollectiveSmartData Collective
Font ResizerAa
Search
  • About
  • Help
  • Privacy
Follow US
© 2008-23 SmartData Collective. All Rights Reserved.
SmartData Collective > Uncategorized > Reinventing the Analytics Experience, Sideways
Uncategorized

Reinventing the Analytics Experience, Sideways

Timo Elliott
Timo Elliott
5 Min Read
Reinventing the Analytics Experience, Sideways
Illustration generated with FLUX.2 [klein 4B] via Cloudflare Workers AI.
SHARE

Over the last quarter-century, the analytics industry has slowly gathered a lot of different technology options. Starting with simple reporting, there has been a steady increase in the number of different features available. These include data integration and data quality, data exploration and data visualization, predictive analytics, and specialized tools for areas such as map-based analytics and text analytics. And finance users have had their own selection of analysis tools, including budgeting and planning, and scorecard systems for tracking high-level KPIs.

At one level all of these tools do the same thing: help organizations get the most value possible out of their information assets. But the different technologies typically came from different backgrounds and traditions, and were originally designed for different types of users.

Over time, the needs of different types of business users have blurred. Today if you want to fully leverage all of these different features across the organization, or as an individual, you typically have to install lots of different servers and interfaces. The resulting complexity has limited how much organizations have actually implemented.
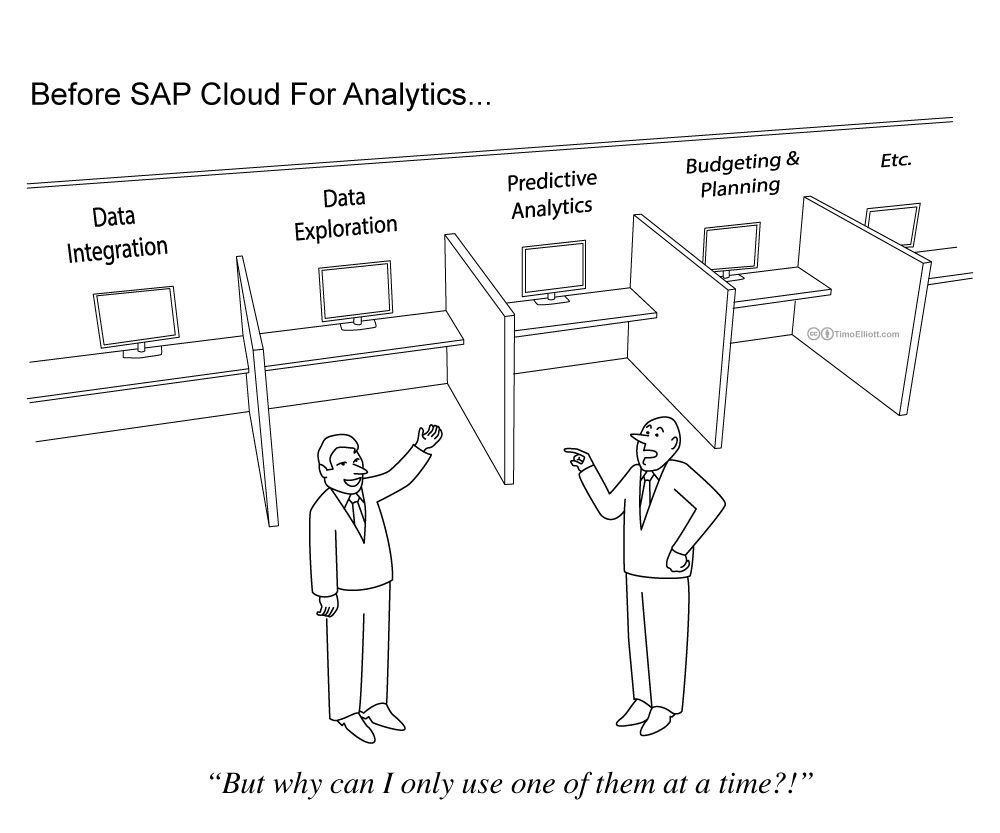
SAP Cloud for Analytics CartoonBut what if you could do all of this with a single, blazingly-fast platform that you didn’t even have to install? And you could provide a single interface that blended the best of all of these capabilities to reflect the new, more agile world of work?

More Read

Santa and SAS Again: Santa's Dashboard
Santa and SAS Again: Santa’s Dashboard
7 Mistakes In Enterprise Data Management You Can’t Afford to Make: Speaking at DAMA WI & DAMA Chicago
Advice to mid-sized companies not yet committed to BI: Get started, but don’t try doing too much too soon
4 Retail BI Lessons to Learn from Google’s Nexus Fail
China’s Censorship Threaten the Availability of American Public Clouds in the Region

That’s the primary innovation behind SAP Cloud for Analytics, based on SAP HANA. All the engines that you might need for analytics are now available directly within the SAP HANA platform — not just advanced querying, data exploration, and native support for hierarchies, but also data integration and data quality algorithms, complex event processing, budgeting and predictive algorithms, text analytics, geo-spatial calculations and more.

Having all this functionality in a single platform means you’re no longer constrained by the historical feature silos. It holds out the promise of new ways of working that let you freely combine different aspects of analytics without having to jump between separate tools.

For example, you could:

  • Easily integrate and cleanse combinations of corporate, personal, and third-party data, whether it’s from on-premise systems or in the cloud.
  • Provide more insightful, accurate budget forecasts using predictive algorithms on “signal” data, such as customer sentiment.
  • Easily combine and analyze structure and unstructured data, whether it’s stored in relational databases, platforms such as Hadoop, or Google sheets.
  • Use predictive algorithms to automatically identify data outliers and trends, cluster data into meaningful groups, or determine the key factors that influence the desired outcomes.
  • Augment data exploration with sophisticated geographical mapping
  • Get closer to the vision of “Big Data Discovery”
  • And much, much more.

And because of SAP HANA’s powerful “HTAP” capabilities, all this can be carried out on real-time operational data. The instant a row-level transaction hits the system, the data is immediately available for sophisticated analysis, without requiring slow, batch-based aggregations.

The future of analytics is using the power of today’s in-memory platforms to fundamentally rethink interfaces, breaking down historic silos and giving business people the power to combine all of the best of analytics and planning.

SAP Cloud for Analytics is in the forefront of this new era. To find out more, visit www.sapcloudanalytics.com


Share This Article
Facebook Pinterest LinkedIn
Share

Follow us on Facebook

Latest News

How Local Service Businesses Can Map Which Neighborhoods Generate the Most Revenue -- AI-generated illustration
How Local Service Businesses Can Map Which Neighborhoods Generate the Most Revenue
Business Intelligence
Best VMware Alternatives in Thailand for Private Cloud and HCI Deployments -- AI-generated illustration
Best VMware Alternatives in Thailand for Private Cloud and HCI Deployments
Cloud Computing Exclusive IT
Using Safety Metrics and Incident Data to Reduce Construction Risk and Insurance Costs -- AI-generated illustration
Using Safety Metrics and Incident Data to Reduce Construction Risk and Insurance Costs
Big Data Exclusive
How Business Intelligence Can Help Small Businesses Build Better Decision Rules -- AI-generated illustration
How Business Intelligence Can Help Small Businesses Build Better Decision Rules
Business Intelligence Business Rules Exclusive

Stay Connected

1.2KFollowersLike
33.7KFollowersFollow
222FollowersPin

You Might also Like

Big Data, ESP and Transubstantiation
Uncategorized

Big Data, ESP and Transubstantiation

8 Min Read
Microsoft’s Dallas Copies BusinessObjects Information OnDemand
Uncategorized

Microsoft’s Dallas Copies BusinessObjects Information OnDemand

2 Min Read
Evolution of the User Interface
Uncategorized

Evolution of the User Interface

8 Min Read
Social customer service
Uncategorized

Social customer service

6 Min Read

SmartData Collective is one of the largest & trusted community covering technical content about Big Data, BI, Cloud, Analytics, Artificial Intelligence, IoT & more.

The Art of Conversation: Enhancing Chatbots with Advanced AI Prompts
Chatbots
ai chatbot
How AI Website Chatbots Improve Customer Support and Lead Generation
Chatbots Exclusive

Quick Link

  • About
  • Contact
  • Privacy
Follow US
© 2008-26 SmartData Collective. All Rights Reserved.
Welcome Back!

Sign in to your account

Username or Email Address
Password

Lost your password?