
As companies clamor to go digital, IT budgets are on the rise, but what exactly do we get for all that money?
Nearly 65 percent of U.S. organizations reported an increase in IT budgets in 2014, according to the annual SIM IT Trends Study, with the average percentage of revenue allocated to IT this year at more than five percent.

Similarly, Gartner reports the top three industries with the largest IT spend are media and entertainment; banking and finance; and software and internet companies. Each spends an average of 5, 6.5 and nearly 7 percent of revenue on IT, respectively.
IT is too important and too expensive not to measure its effectiveness and efficiency, especially as it goes through historic changes in its delivery and consumption.
CEOs and company boards clamor for new digital capabilities to improve their customers’ experiences, drive organic revenue growth, increase agility and create competitive advantages.
To speed deployment of digital business capabilities, technology budgets and spending are bleeding beyond IT’s walls and landing across the business. Chief marketing officers, chief digital officers and chief innovation officers – to list a few –now control almost 40 percent of the traditional IT budget, Gartner reports. That number is expected to rise as high as 80 percent over the next three to five years.
How will the organization and board measure the effectiveness of this “New IT” world?
Corporate performance management traditionally struggles with deploying a model to measure IT’s business value. Many efforts degrade into techno-babble and overstated, unsubstantiated assertions about IT project ROI or IRR that result in the C-suite discarding or discounting any value claims.
With new desire for rapid deployment of digital capabilities, now is the perfect time to shed the failed IT measurement models for a simple and accurate approach.
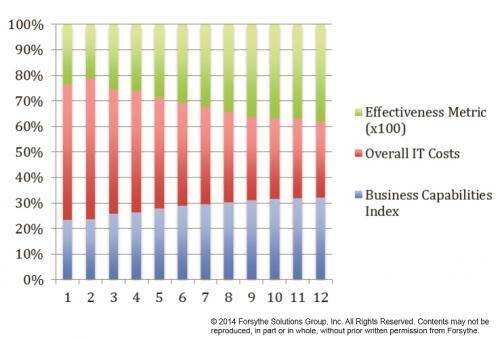
The New IT Metric
Business capabilities, divided by costs. It’s math, not rocket science.
This ratio should become the standard for measuring IT effectiveness. Much like miles-per-gallon measures a car’s efficiency, dividing business capabilities by department costs becomes the MPG of IT.
Consistently measuring business capabilities is essential, so the numbers don’t waver as components and competencies change over time. Some business capabilities aren’t necessarily numeric by nature, but a scoring index is possible. As long as you’re consistent with how you score them, you can create numeric values and data models that can be governed.
Consuming financial data from accounting and other systems of record can accurately assemble IT costs. Data-driven metrics ensure reliability and legitimacy. Moreover, using business capabilities as the desired outcome of IT improves the dialog across the organization – everyone is clear that investments in technology are there to drive new or better business capabilities.
Skeptics and naysayers will argue for more measurements and a wider, more granular model of measuring the business value of IT. This approach has been pursued for the last 20 years or more with limited effectiveness, which some would say proves the need for new thinking.
Business Capabilities/IT Costs is the proper metric to accurately show any CEO or board their IT organization’s effectiveness, while fitting nicely into a corporate performance management dashboard.
Over the long-term, organizations can determine if they should share this metric with investors or use it as a valid benchmarking comparison with other companies.

New IT models provide business with agility, speed, digital capabilities and customer-centric approaches to drive organic growth and profitability. Measure the impact of New IT in a new, meaningful and elegant way.


