We use cookies, including third-party cookies from Google to serve personalized ads through AdSense, to operate this site and understand how it is used. By continuing to browse, you accept this use. See our Privacy Policy and Terms of Use for details, including how to opt out of personalized advertising.
Accept
SmartData CollectiveSmartData Collective
  • Analytics
    AnalyticsShow More
    Flat editorial illustration: The article is about joining public web signals with internal business metrics so BI teams can inter
    Alternative Data in BI: Bringing Public Web Data Into Your Dashboards
    23 Min Read
    Flat editorial illustration: The article is about automating the collection, preparation, and delivery of marketing data across p
    From Data to Dashboards: 5 Marketing Reporting Automation Software Picks
    12 Min Read
    Flat editorial illustration: The article contrasts passive follower totals with a behavioral path from attention and trust to cli
    Creator Analytics Beyond Follower Count: Seven Metrics That Measure Audience Behavior
    11 Min Read
    Flat editorial illustration: The article connects AI and marketing analytics with managerial judgment grounded in consumer behavi
    How an Online MBA in Marketing Connects AI and Data Analytics
    11 Min Read
    What Kind of Problem-Solving Distinguishes Data Analysts From Software Engineers -- AI-generated illustration
    What Kind of Problem-Solving Distinguishes Data Analysts From Software Engineers
    7 Min Read
  • Big Data
  • BI
  • Exclusive
  • IT
  • Marketing
  • Software
Search
© 2008-25 SmartData Collective. All Rights Reserved.
Reading: Security and Data Visualization- Use the NCTC WITS system
Share
Notification
Font ResizerAa
SmartData CollectiveSmartData Collective
Font ResizerAa
Search
  • About
  • Help
  • Privacy
Follow US
© 2008-23 SmartData Collective. All Rights Reserved.
SmartData Collective > Big Data > Data Visualization > Security and Data Visualization- Use the NCTC WITS system
Data VisualizationSecurity

Security and Data Visualization- Use the NCTC WITS system

BobGourley
BobGourley
3 Min Read
Security and Data Visualization- Use the NCTC WITS system
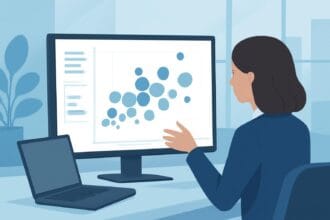
Illustrative image generated with OpenAI gpt-image-1.
SHARE

The work of the National Counterterrorism Center (NCTC) is important and, because of the need to protect our nation’s information sources and advantages over international terrorists, criminals and other malicious actors, is not discussed much in the open. But there are things you can learn about NCTC by review of reputable sources. The most important source is testimony of its leadership to Congress.  For example, see the statement of The Honorable Michael E. Leiter of 9 Feb 2011.  These guys have a very hard job to do and we have great leadership in place here to get it done.

Another good source on what they do is the website at NCTC.gov. The info they put there is intentionally designed to inform us on the threat and what the country is doing about it. It is all worth a review.

As a techie, one of the things I really appreciate about the unclassified NCTC site is the automated information discovery tool they provide for research into terrorism incidents. Unclassified information on terror attacks can help academic research, security studies and even research into counter terror technologies. To see how they provided it, visit the site for the Worldwide Incident Tracking System (WITS). This system provides statistical information in a searchable format focused on discovery of trends and relationships.

The WITS system is available at: https://wits.nctc.gov

More Read

Seven Misconceptions about Data Quality
Incorporating IoT? Plan to Incorporate Cybersecurity
From Raw Data to Visualization: Marvel Social Graph Analysis
Data & AI Architecture Focus: 6 Best Brand Protection Tools for Phishing and Impersonation
Biggest Trends in Data Visualization Taking Shape in 2026

Visiting that URL brings up a familiar “Endeca-like” interface into the incident data. This lets you navigate all reported incidents by multiple paths.  You can search, you can correlate, you can plot on maps with density clusters and heat maps, you can navigate through tag clouds and concept clouds, and you can continuously iterate in and learn from your research as you go.

I would like to see more government organizations presenting their information this way. A couple already are.  For example, the entire US Census is now available from this sort of interface.  But I’m proud to say NCTC was leading the way in getting info out to our citizens via this type of interactive interface.


Share This Article
Facebook Pinterest LinkedIn
Share

Follow us on Facebook

Latest News

Flat editorial illustration: The article connects downstream report failures, data-quality gaps, and conflicting metric definitio
Signs Your Data Architecture Needs an Outside Review
Big Data Exclusive
Data-Driven Pultrusion: Best GFRP Rebar Machines & ROI
Big Data Exclusive
Flat editorial illustration: The article contrasts tools for gathering fresh interviews with tools for analyzing existing qualita
10 AI Market Research Tools That Turn Qualitative Data into Insights
Artificial Intelligence Big Data Exclusive
Flat editorial illustration: The article compares proxy MCP servers by what an AI agent can do through them: manage proxy account
Proxy MCP Servers: 7 Options and What Each Lets an AI Agent Do
Artificial Intelligence Big Data Data Collection

Stay Connected

1.2KFollowersLike
33.7KFollowersFollow
222FollowersPin

You Might also Like

AI-Driven Ransomware is a Terrifying Threat to Businesses
Security

AI-Driven Ransomware is a Terrifying Threat to Businesses

10 Min Read
Analyze Data with Bubble Plots in SAS Visual Analytics
Data Visualization

Analyze Data with Bubble Plots in SAS Visual Analytics

4 Min Read
A year on: The promise of SAP HANA for Big Data analytics (Part Two)
AnalyticsBusiness IntelligenceData VisualizationData Warehousing

A year on: The promise of SAP HANA for Big Data analytics (Part Two)

0 Min Read
Business, Analytics and Technical User Roles When Automating Decisions
AnalyticsBest PracticesCommentaryData MiningData QualityData Visualization

Business, Analytics and Technical User Roles When Automating Decisions

15 Min Read

SmartData Collective is one of the largest & trusted community covering technical content about Big Data, BI, Cloud, Analytics, Artificial Intelligence, IoT & more.

Chatbots and SEO: How Can Chatbots Improve Your SEO Ranking?
Artificial Intelligence Chatbots Exclusive
AI chatbots
AI Chatbots Can Help Retailers Convert Live Broadcast Viewers into Sales!
Chatbots

Quick Link

  • About
  • Contact
  • Privacy
Follow US
© 2008-26 SmartData Collective. All Rights Reserved.
Welcome Back!

Sign in to your account

Username or Email Address
Password

Lost your password?