

We have talked in the past about the importance of data visualization in business. One study by Robert Horn at Stanford found that 64% of participants made a decision immediately after watching a presentation with an overview map.
However, many companies are struggling to figure out how to use data visualization effectively. One of the ways to accomplish this is with presentation templates that can use data modeling. Keep reading to learn more.
Taking Advantage of Data Visualization with Presentation Templates
It’s essential to make sure that information is communicated clearly in an age when everyone is working from home. As many businesses swap meeting rooms for Zoom calls, the task of sharing data in an engaging way has become more challenging. While body language and face-to-face interaction has been lost in WFH environments, screen sharing and cloud storage means that our presentations can be more accessible and more detailed than ever before.
Sadly, the task of making a great presentation can be a daunting one for many individuals. It is even more complicated when you need to implement data visualization. For the many of us who aren’t natural graphic designers, we need to know how we can create a visually effective presentation from scratch that will help to clearly communicate the key points on our agendas while effectively explaining things without overwhelming our audience.
This is where platforms like Powered Template can enter the fray and help companies make the most of data visualization technology. Through Powered Template, users have access to more than 90,000 pre-designed slides that are available to download and edit on-demand. They can utilize data visualization tools to create even more effective presentations.
Powered Template’s extensive repertoire of pre-prepared templates allows you to build presentations with ease and to create stunning data-driven visualisations. Let’s take a deeper look into how:
Creating a Presentation to Suit your Goals
Powered Template showcases pre-prepared templates for Microsoft PowerPoint, Google Slides, and Apple Keynote presentation platforms. It also boasts a highly intuitive menu system to allow users to pinpoint exactly what they’re looking for in terms of creating the presentation that suits their goals. It is one of the most remarkable solutions in data visualization for anyone trying to make a great presentation.
Significantly, Powered Template’s menu system updates data in real-time and allows users to combine criteria to gain access to more intuitive results.
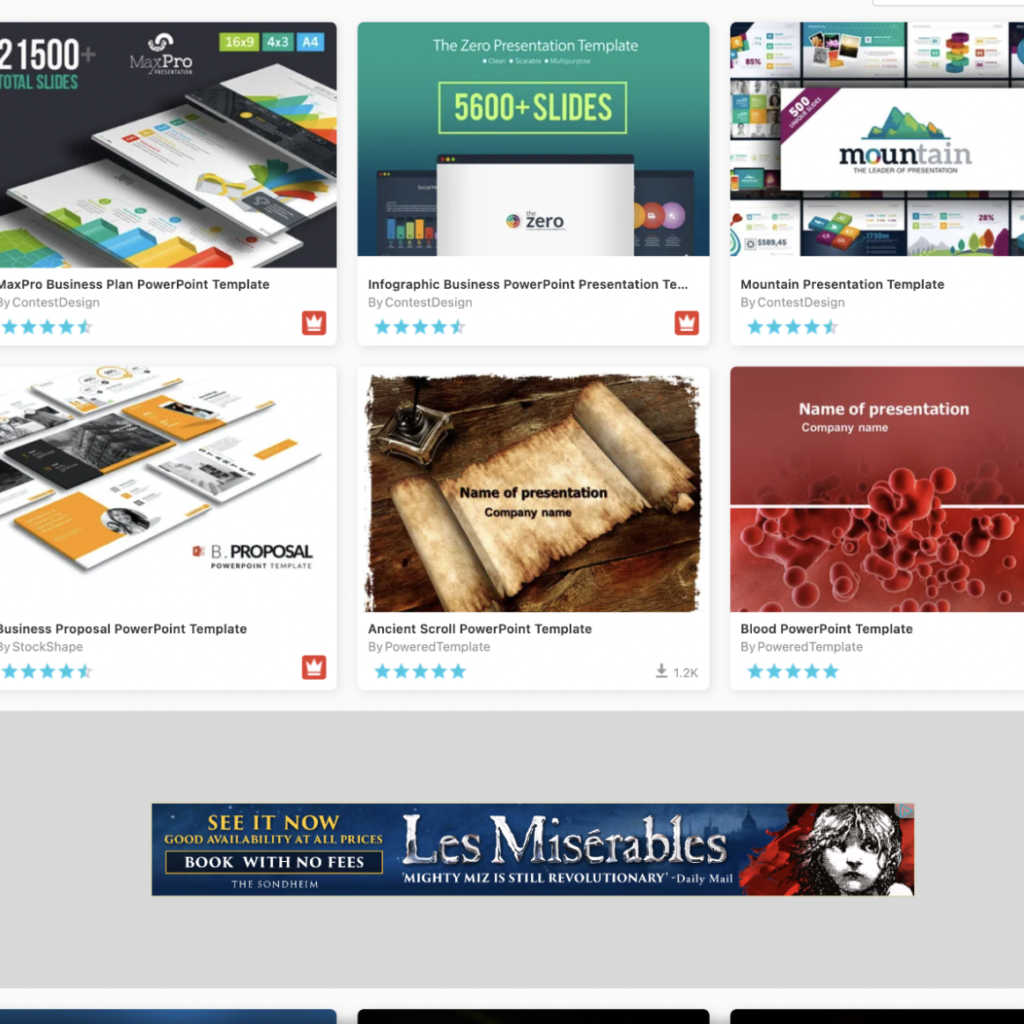
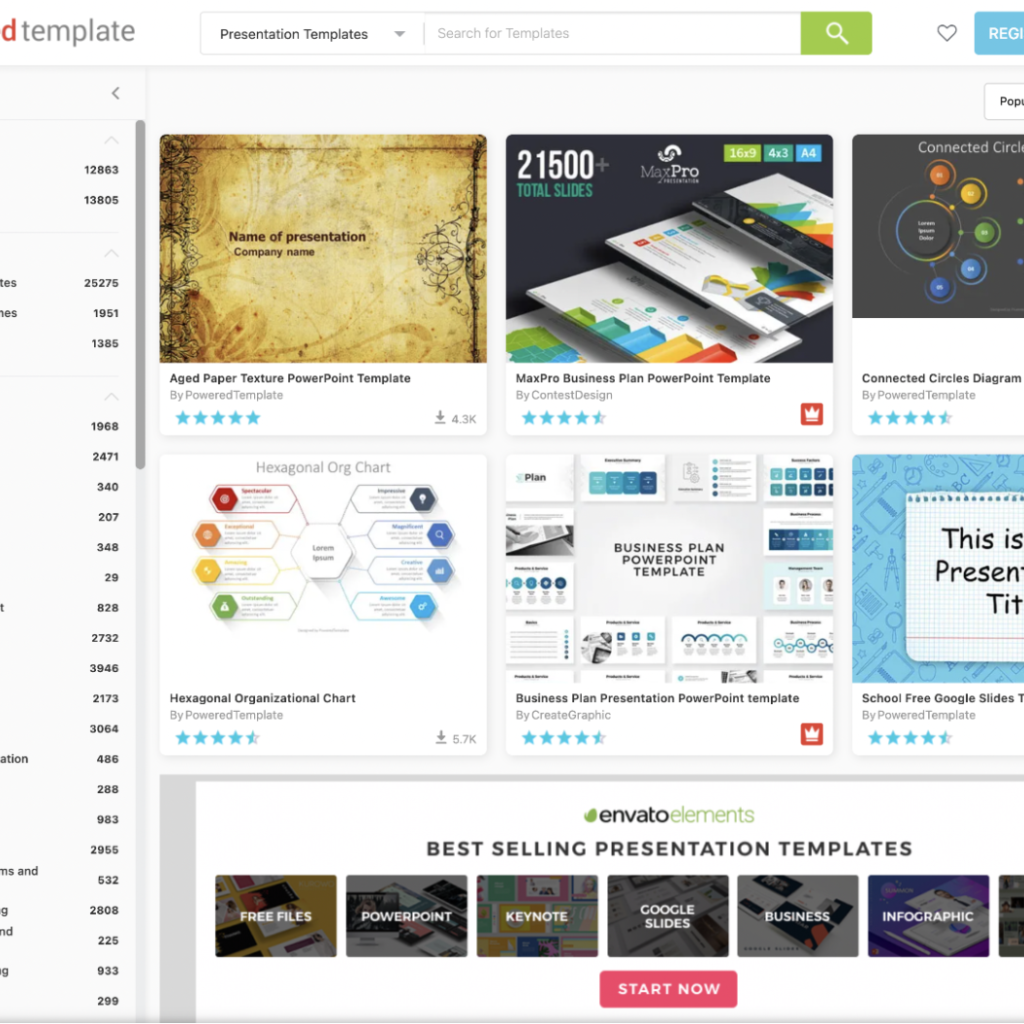
For instance, let’s take a deeper look at what appears if we search for 3D data driven diagrams and charts. Upon running the search, Powered Templates has returned a total of 2,500 options that suit the descriptions that are being queried.
For ease of reference, each template comes with an average star rating provided by users and a figure that shows how often the template has been downloaded. Images of crowns on red backgrounds signify premium content which require either a subscription or a signup.
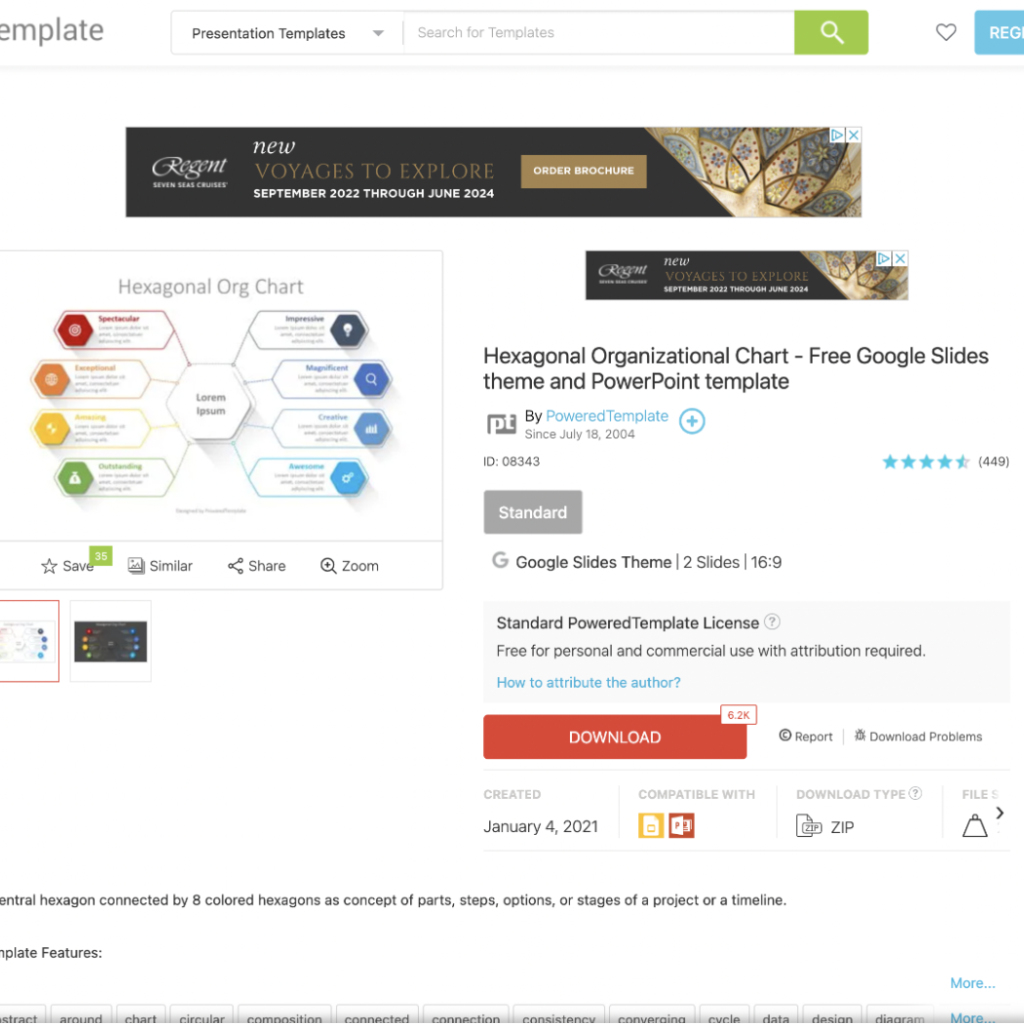
As an example of how Powered Template can help bring presentation data to life, let’s take a deeper look at this template for a hexagonal organisation chart. Let’s imagine that the colour coordination and space for eight central points within the chart is perfect for the message that I’m looking to get across to my audience and that I want to use the template for myself.
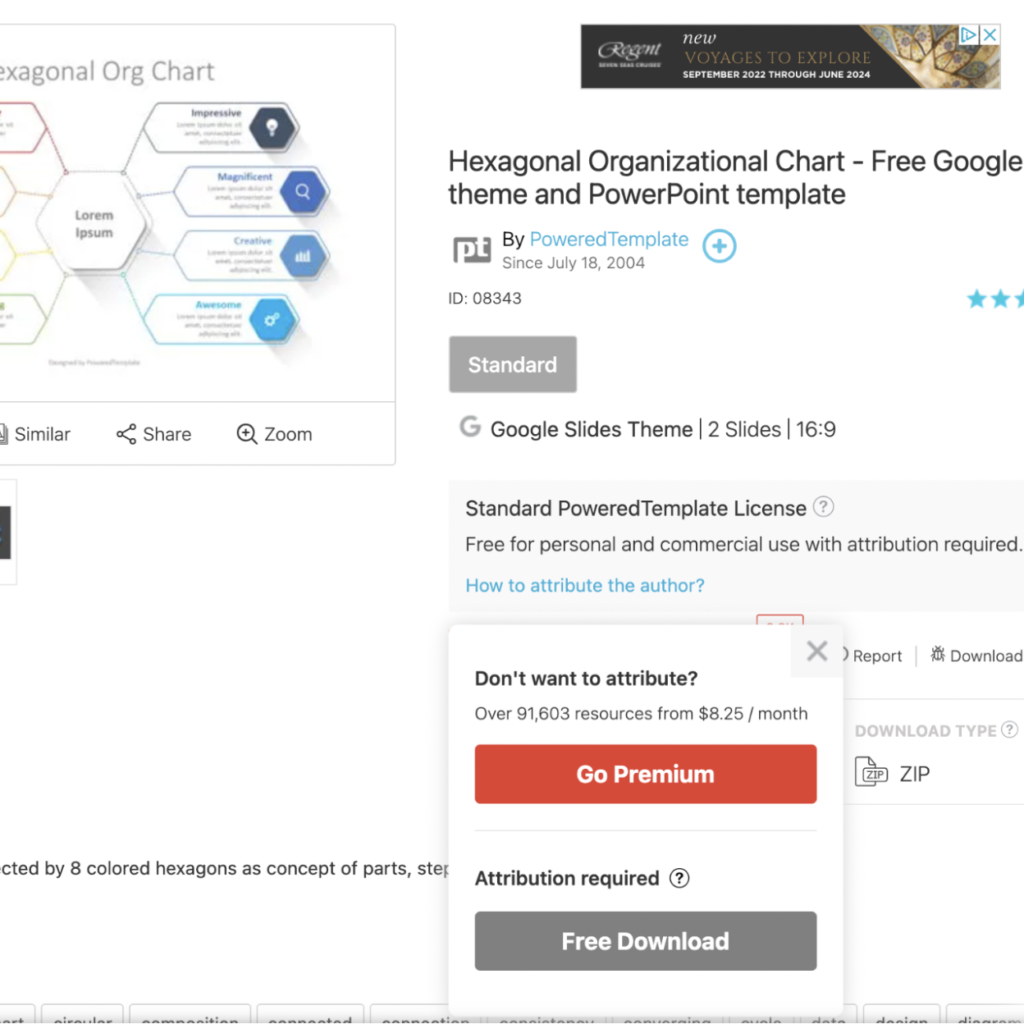
To access the chart, I can either be a premium account holder, or appropriately attribute the presentation to Powered Template when it comes to using the template to create data visualization. Upon selecting the option that suits my needs best, I’m ready to load the template in my chosen presentation software.
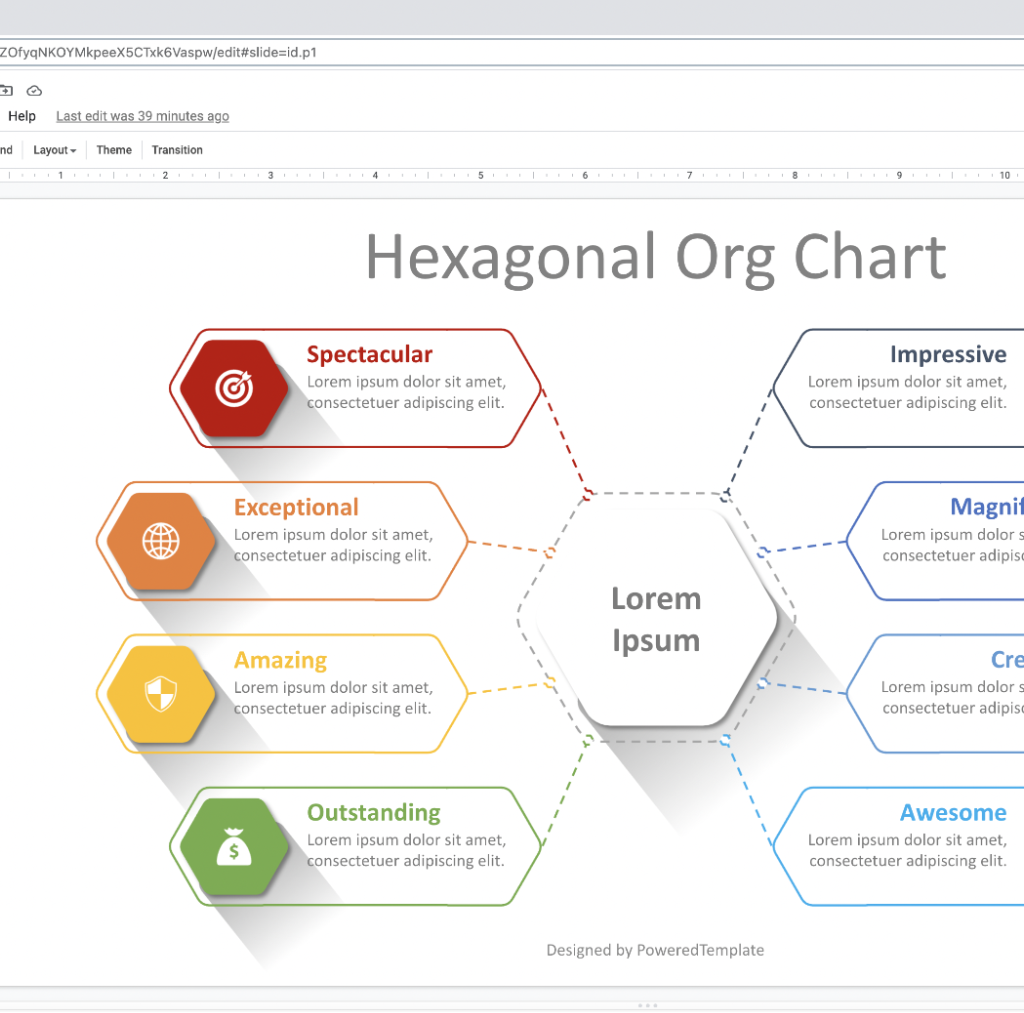
Now my template is ready to become a fully-fledged actionable part of my presentation. As we can see, there is plenty of placeholder text which signifies where I can begin adding my own content to begin sharing data.
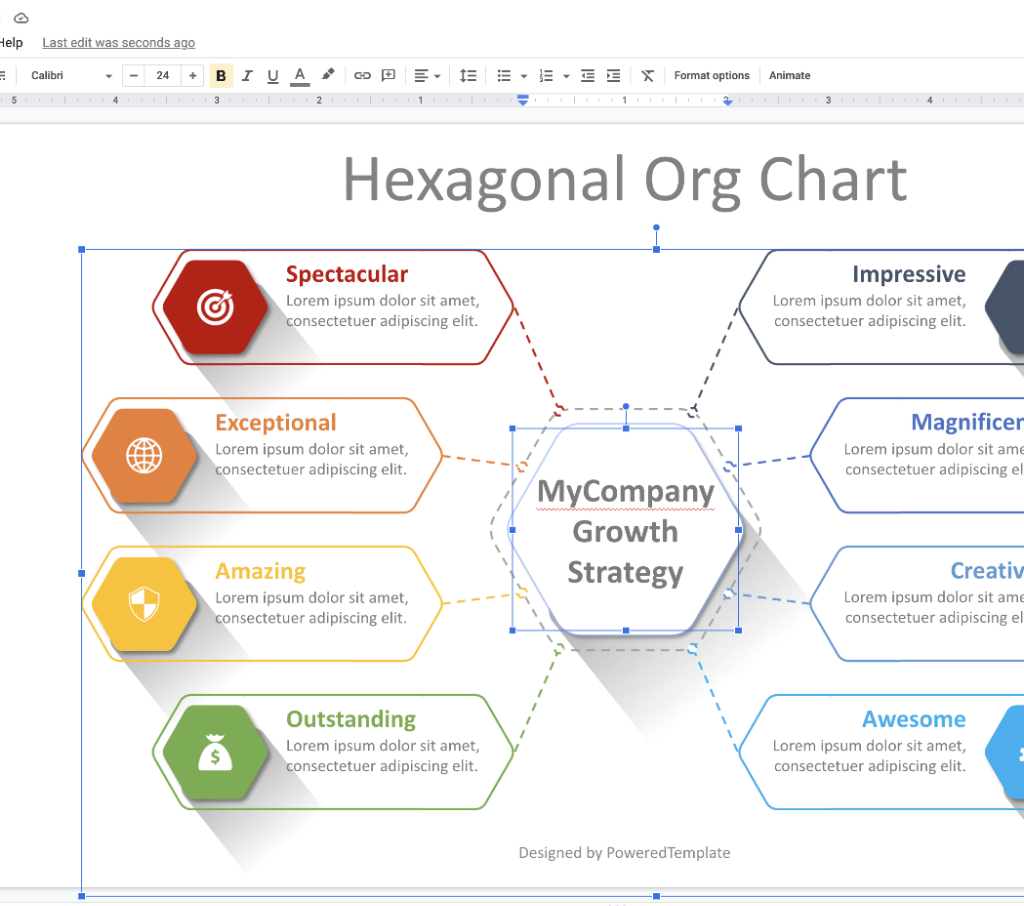
As we can see from the image above, all aspects of the template are free to edit, and the content arrives readily attributed for free users. To seamlessly include your visualisations as part of a larger, more comprehensive presentation, you can simply build your slide before copying and pasting into a pre-prepared presentation – or by combining it with another template that’s formatted in a suitable manner.
Data Visualization Templates on Demand
One of the best perks of Powered Template is the fact that the platform’s pricing structure is highly adaptable to suit the needs of all users and organizations. It is one of the many reasons companies can use this data visualization solution.
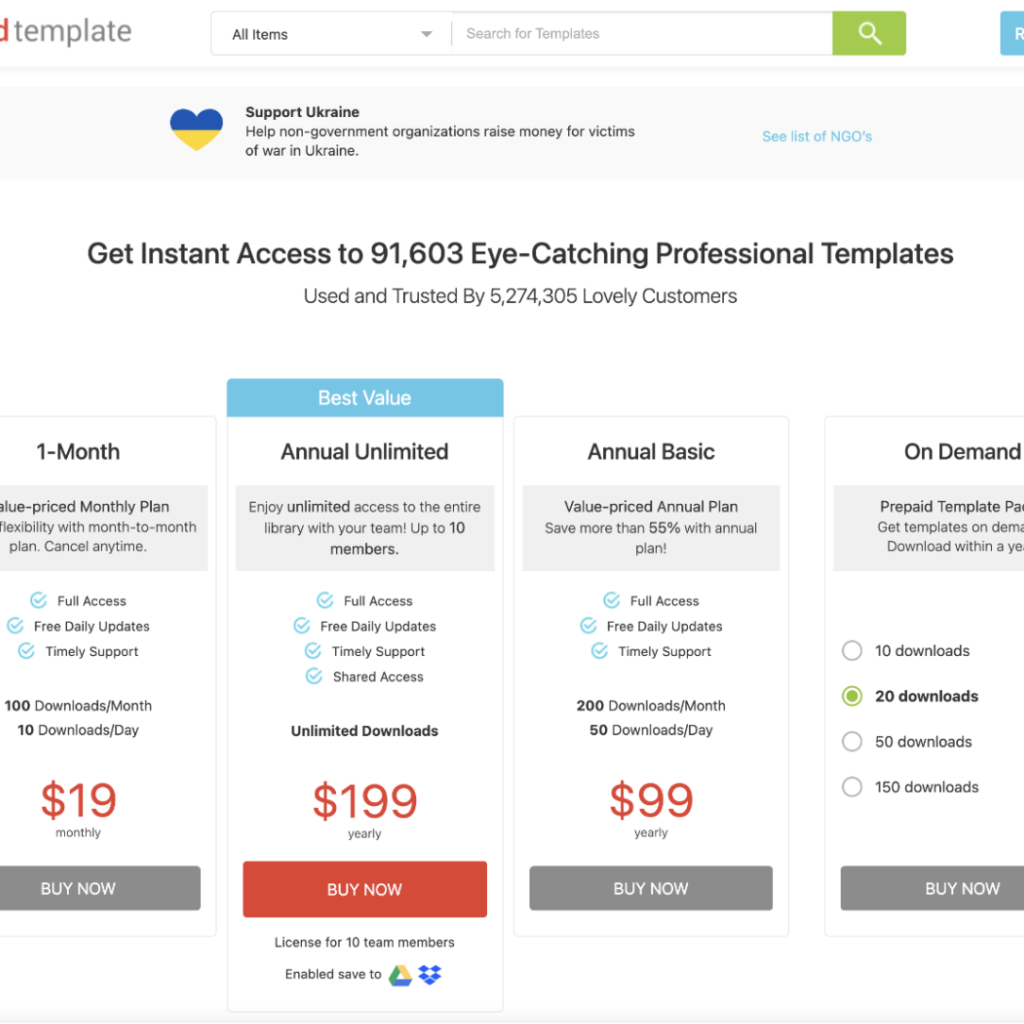
When it comes to subscription services in order to access premium quality content, users have the option of paying on a monthly basis for short term access, buying an annual subscription at a far more effective monthly cost – or even to purchase an on-demand subscription which allows users to access 10, 20, 50, or 150 template downloads as and when they want.
This highly adaptable pricing structure means that users can find a balance that suits their needs, even if they’re unlikely to seek out many templates on a recurring basis.
Another great aspect of Powered Templates is the fact that the website supports a useful live chat function which puts visitors in touch with an agent at the touch of a button. This can be highly useful for individuals who may not be experienced in downloading presentation templates, or those who need a little help understanding how to access a download within their chosen presentation software.
Powered Templates’ dedication towards serving all users – whether they’re causal individual users or Fortune 500 companies is likely a key reason behind why the company continues to thrive despite operating since 2004.
Powered Template is a Fantastic Presentation Tool for Using Data Visualizations Effectively
Packed with a vibrant community of creators and new templates being uploaded to the platform on a daily basis, we can expect Powered Template to continue to aid its ever-growing user base for many more years to come. It is a pioneer in presentation creation for companies that want to make the most of data visualization.


