We use cookies, including third-party cookies from Google to serve personalized ads through AdSense, to operate this site and understand how it is used. By continuing to browse, you accept this use. See our Privacy Policy and Terms of Use for details, including how to opt out of personalized advertising.
Accept
SmartData CollectiveSmartData Collective
  • Analytics
    AnalyticsShow More
    chatgpt image jul 21, 2026, 04 34 30 pm
    4 Core Benefits of Predictive Maintenance after Vibration Analysis
    10 Min Read
    How Does Data Mining Boost Customer Satisfaction in Logistics? Harnessing Analytics for Results -- AI-generated illustration
    How Does Data Mining Boost Customer Satisfaction in Logistics? Harnessing Analytics for Results
    11 Min Read
    chatgpt image jul 13, 2026, 04 23 45 pm
    How Data Analytics Helps Companies Improve User Engagement
    19 Min Read
    chatgpt image jul 13, 2026, 03 59 46 pm
    How Data Analytics Improves Multi-Location Search Strategies
    10 Min Read
    cybersecurity efforts
    How Behavioral Analytics and AI Are Redefining Cybersecurity for Boca Raton Businesses
    14 Min Read
  • Big Data
  • BI
  • Exclusive
  • IT
  • Marketing
  • Software
Search
© 2008-25 SmartData Collective. All Rights Reserved.
Reading: How Digital Experience Monitoring and Customer-Centric IT Makes Everyone Happy
Share
Notification
Font ResizerAa
SmartData CollectiveSmartData Collective
Font ResizerAa
Search
  • About
  • Help
  • Privacy
Follow US
© 2008-23 SmartData Collective. All Rights Reserved.
SmartData Collective > Analytics > How Digital Experience Monitoring and Customer-Centric IT Makes Everyone Happy
AnalyticsCommentaryData ManagementITNew Products

How Digital Experience Monitoring and Customer-Centric IT Makes Everyone Happy

Mike_Urbonas
Mike_Urbonas
4 Min Read
How Digital Experience Monitoring and Customer-Centric IT Makes Everyone Happy
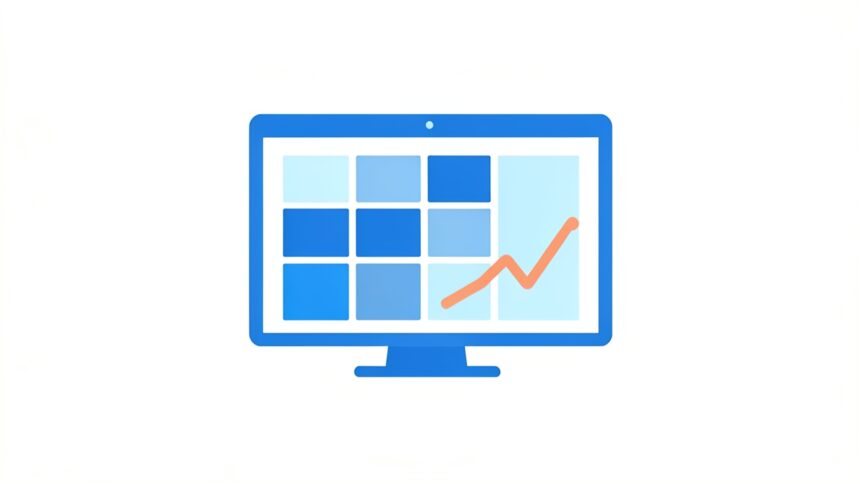
Illustration generated with FLUX.2 [klein 4B] via Cloudflare Workers AI.
SHARE

The most successful CIOs and IT teams have empathy for their end users and focus on making sure they’re happy. That’s not just some feel-good message; it’s SAP CIO Thomas Saueressig’s recommendation for running a strategic, successful IT organization today, amid the disruptions of digital transformation. It’s also the plan that is most likely to make IT professionals happy.

“We need to put employee productivity at the center of IT activities,” Thomas Saueressig said in a ZDNet interview. “The key goal for every IT employee is customer satisfaction [among internal employees]. We want to excite them and inspire them.”

Saueressig’s “most important KPI” is the satisfaction and happiness of SAP’s 78,000 global internal end users. “Happiness is a competitive advantage,” he added. If we have happy employees, they will make our customers happy. This is a direct correlation.”

Such a customer-centric IT model is still relatively uncommon. IT expert and ZDNet contributor Dion Hinchcliffe remarked that his interview with Saueressig was “quite literally the first time I’ve heard the word ‘happiness’ used by a major CIO, or tied it to competitive advantage.”

More Read
WayIn Adds Another Dimension to Polling
Report: Cloudera looks to go public as demand for Big Data solutions grow
How Big Data can Help Marketers Cater to an International Audience
Benefits of Using Data Analytics in Equipment Financing
Future Proofing Employee Satisfaction Trends With Data Analytics

IT pros must “understand the business in its entirety and have empathy for end users”

Being a technologist is no longer enough; IT pros must “understand the business in its entirety and have empathy for end users.” To achieve this, Saueressig recommends IT professionals engage in user shadowing – actively observing first hand what business processes end users must accomplish and how they perform them – often requiring the use of multiple applications. From there, virtual user technology is especially powerful for putting new end user insights to active use to ensure consistently excellent end user experiences.

Unlike other tools used to monitor end user digital experience, virtual user-powered digital experience monitoring solutions (notably Login PI) very closely simulate real-world workers and the particular combinations of applications they regularly use. The customer-centric IT department, having learned about their real-world user workloads, can readily define virtual user workloads that closely match the actual step-by-step activities workers actually take to perform key business processes.

By measuring the time required for each step taken by a virtual user, IT operations can accurately predict infrastructure issues that will impair user experience and correct them before end users are affected.

We have expressed the resulting superior level of user experience and superior strategic level of IT service as a Digital Experience Monitoring Maturity Model (see chart above). This model visualizes the evolution of digital experience monitoring and management from basic application performance monitoring, to real user monitoring (RUM), synthetic transactions, and finally, to virtual users. We will be exploring this maturity model in much more detail, and welcome your thoughts!

Customer-focused IT professionals with a deep understanding of end users will find virtual user-powered digital experience management like Login PI to be a force multiplier to optimize end-user experiences, maximize productivity and eliminate business interruptions. They will also gain recognition as a vital strategic asset to the organization, instead of a commoditized IT services provider. Now that’s something everyone should feel happy about.


Share This Article
Facebook Pinterest LinkedIn
Share

Follow us on Facebook

Latest News

Analyst points at colorful circular data dashboard on screen - information technology business metrics
How Fragmented Workplace Tech Undermines Reliable Business Metrics and Reporting
Cloud Computing Exclusive Infographic IT
Using Multi-Source Data and Analytics to Detect Operational Drift Across Franchise Networks -- AI-generated illustration
Using Multi-Source Data and Analytics to Detect Operational Drift Across Franchise Networks
Exclusive Infographic
Beyond The First Impression: The Long-Lasting Impact Of Sensory Marketing -- AI-generated illustration
Beyond The First Impression: The Long-Lasting Impact Of Sensory Marketing
Infographic Marketing
The Infrastructure Gap Slowing Data Center Growth -- AI-generated illustration
The Infrastructure Gap Slowing Data Center Growth
Big Data Cloud Computing Exclusive Infographic IT

Stay Connected

1.2KFollowersLike
33.7KFollowersFollow
222FollowersPin

You Might also Like

Governments Must Leverage Data for Smart Growth
Analytics

Governments Must Leverage Data for Smart Growth

5 Min Read
Cloud ERP – Efficient, Innovative, or Both?
Business RulesCloud Computing

Cloud ERP – Efficient, Innovative, or Both?

7 Min Read
Uncertainty Coefficients for Features Reduction - Comparison with LDA Technique
AnalyticsData MiningText Analytics

Uncertainty Coefficients for Features Reduction – Comparison with LDA Technique

7 Min Read
5 Techniques to Make Your Big Data Analytics More Effective
AnalyticsBig DataData QualityExclusive

5 Techniques to Make Your Big Data Analytics More Effective

6 Min Read

SmartData Collective is one of the largest & trusted community covering technical content about Big Data, BI, Cloud, Analytics, Artificial Intelligence, IoT & more.

AI chatbots
AI Chatbots Can Help Retailers Convert Live Broadcast Viewers into Sales!
Chatbots
From Bolts to Bots: How AI Is Fortifying the Automotive Industry
Artificial Intelligence

Quick Link

  • About
  • Contact
  • Privacy
Follow US
© 2008-26 SmartData Collective. All Rights Reserved.
Welcome Back!

Sign in to your account

Username or Email Address
Password

Lost your password?