We use cookies, including third-party cookies from Google to serve personalized ads through AdSense, to operate this site and understand how it is used. By continuing to browse, you accept this use. See our Privacy Policy and Terms of Use for details, including how to opt out of personalized advertising.
Accept
SmartData CollectiveSmartData Collective
  • Analytics
    AnalyticsShow More
    Flat editorial illustration: The article connects AI and marketing analytics with managerial judgment grounded in consumer behavi
    How an Online MBA in Marketing Connects AI and Data Analytics
    11 Min Read
    What Kind of Problem-Solving Distinguishes Data Analysts From Software Engineers -- AI-generated illustration
    What Kind of Problem-Solving Distinguishes Data Analysts From Software Engineers
    7 Min Read
    chatgpt image jul 21, 2026, 04 34 30 pm
    4 Core Benefits of Predictive Maintenance after Vibration Analysis
    10 Min Read
    How Does Data Mining Boost Customer Satisfaction in Logistics? Harnessing Analytics for Results -- AI-generated illustration
    How Does Data Mining Boost Customer Satisfaction in Logistics? Harnessing Analytics for Results
    11 Min Read
    chatgpt image jul 13, 2026, 04 23 45 pm
    How Data Analytics Helps Companies Improve User Engagement
    19 Min Read
  • Big Data
  • BI
  • Exclusive
  • IT
  • Marketing
  • Software
Search
© 2008-25 SmartData Collective. All Rights Reserved.
Reading: Headaches, Data Analysis, and Negativity Bias
Share
Notification
Font ResizerAa
SmartData CollectiveSmartData Collective
Font ResizerAa
Search
  • About
  • Help
  • Privacy
Follow US
© 2008-23 SmartData Collective. All Rights Reserved.
SmartData Collective > Data Management > Best Practices > Headaches, Data Analysis, and Negativity Bias
AnalyticsBest PracticesBig DataData Management

Headaches, Data Analysis, and Negativity Bias

MIKE20
MIKE20
4 Min Read
Headaches, Data Analysis, and Negativity Bias
Illustration generated with Qwen Image.
SHARE

I have suffered from bad headaches most of my life, but over the last few years they seemed to be getting worse.  Discussing this with my doctor, he asked lots of questions: How often do you get headaches? Do they occur at the same time of day? How long do they last? Are they always severe or sometimes mild? How many doses of over-the-counter medication do you take per headache?

Since I have been a data management professional for over twenty years, I felt kind of stupid when I realized that what my doctor was asking for to aid his medical diagnosis was . . . data.

So for the next two months, in preparation for my follow-up appointment, like a good human sensor, I diligently collected data about my headaches.  For severity, I used a scale of 1 to 5, where 1 was so mild I didn’t need medication, and 5 was so severe I had to lie down for a while in a dark and quiet room.

As I collected the data, I felt certain I was building a solid case for how bad my headaches were.  I had no doubt that the data analysis would prove me right — but I couldn’t have been more wrong.

More Read

Data Mining Fundamentals: Terms You Must Know
Building an Ironclad Business Case for Business Intelligence
The Big Data Analyst’s Skillset
Data Quantity, or Data Quality?
Blogging from Istanbul

Although I remembered frequently having headaches, most of which I recalled being quite severe, the data begged to differ.  On average, I had 3 headaches per week.  Only 33% rated above a 3 on my severity scale.  Only 25% required multiple doses of over-the-counter medication.  And, despite this being my biggest previous complaint to my doctor, only 10% of my headaches lasted most of the day.

How could my memory of those two months disagree so much with the data?

In psychology, the term negativity bias is used to explain how bad evokes a stronger reaction than good in the human mind.  This psychological phenomenon causes us to pay more attention to, and give more weight to our memories of, negative rather than positive experiences.

Negativity bias made me remember the few times when I had a really bad headache, and forget the far more frequent times when I did not.  As it turned out, my doctor’s prescription of data analysis proved he didn’t need to prescribe me stronger headache medication.

Data analysis helps us evaluate business problems, but sometimes it can give us a headache when its results force us to confront a bias we have about our business problems.

(negativity bias / shutterstock)

Share This Article
Facebook Pinterest LinkedIn
Share

Follow us on Facebook

Latest News

Flat editorial illustration: The article’s core relationship is that restoring a refrigeration system does not establish trustwor
After the Cyberattack, Can You Trust the Machine?
Artificial Intelligence News
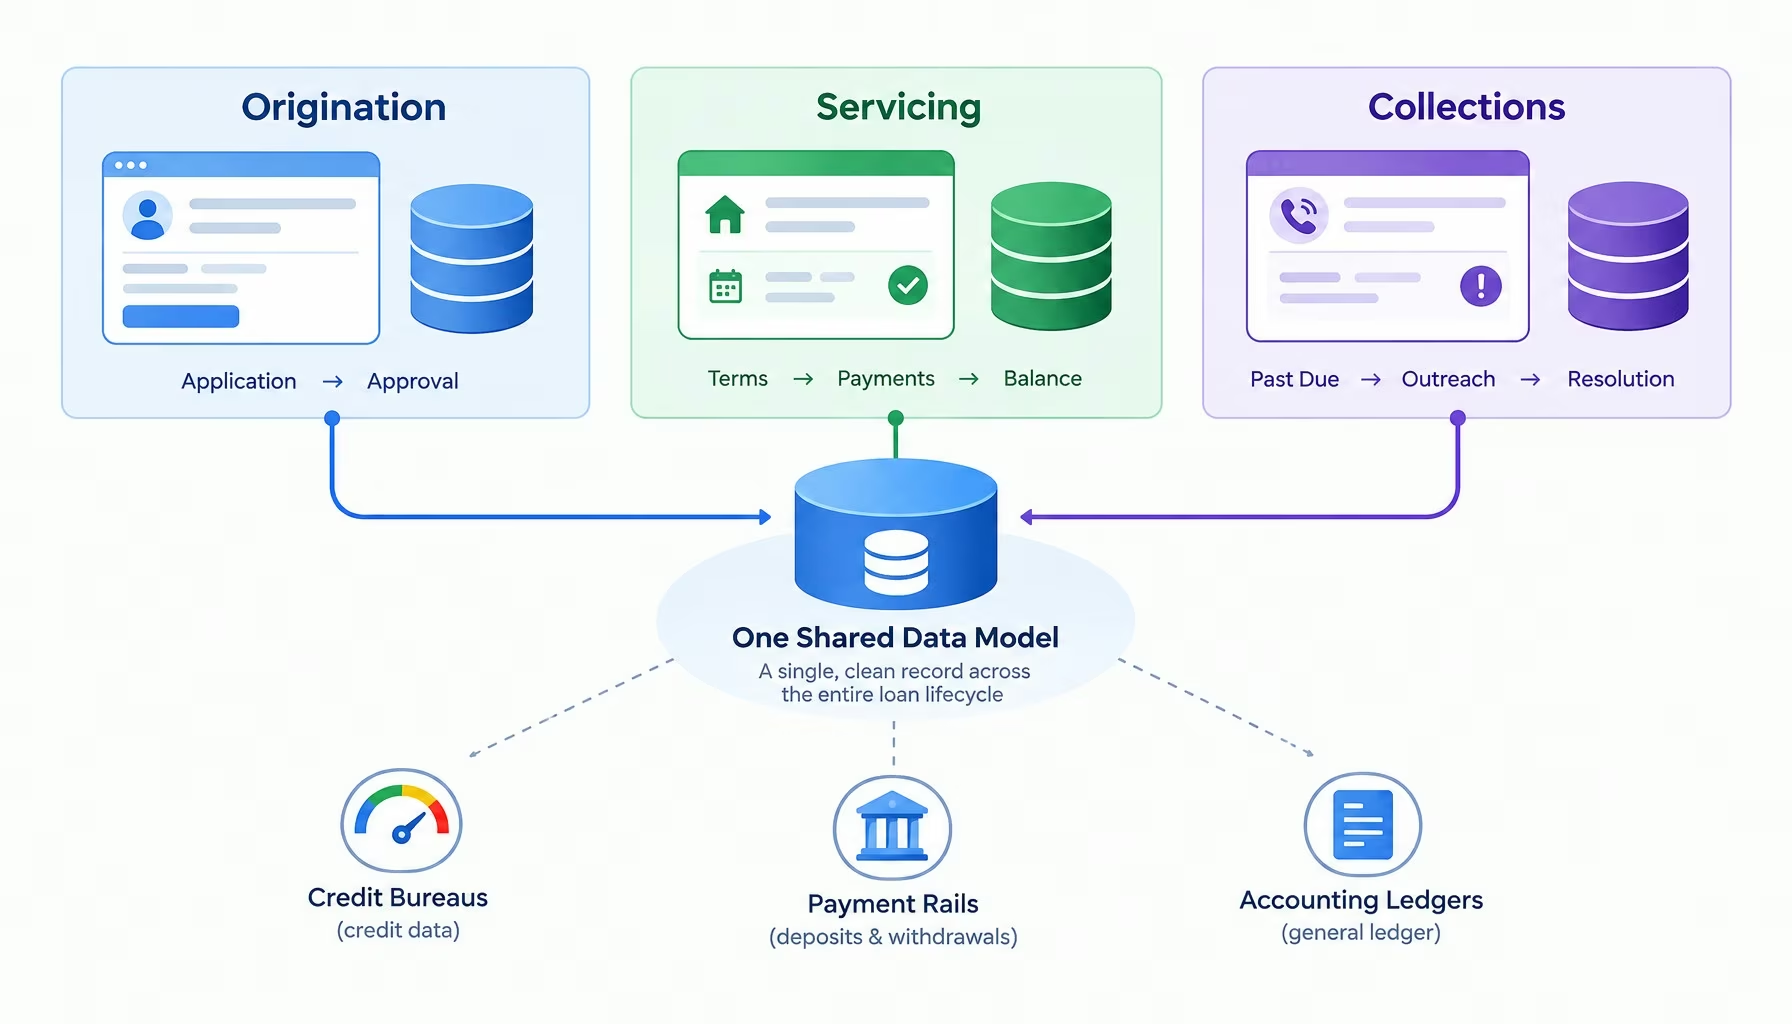
Flat editorial illustration: A technology-editorial comparison of disconnected origination, servicing, and collections records dr
The Data Reconciliation Problem Inside Disconnected Lending Systems
Big Data Exclusive Fintech
Flat editorial illustration: The article connects AI and marketing analytics with managerial judgment grounded in consumer behavi
How an Online MBA in Marketing Connects AI and Data Analytics
Analytics Artificial Intelligence Big Data Exclusive
Flat editorial illustration: The article connects commercial drone capture with integrated software workflows that organize and r
Drone Technology as a Business Investment: Calculating ROI, Costs, and Long-Term Value
Business Intelligence Marketing Software

Stay Connected

1.2KFollowersLike
33.7KFollowersFollow
222FollowersPin

You Might also Like

Analytics is Sexy: Let's Make It Work!
AnalyticsBusiness IntelligencePolicy and Governance

Analytics is Sexy: Let’s Make It Work!

5 Min Read
What you need to be a Business Intelligence Consultant ??
Business IntelligenceData Warehousing

What you need to be a Business Intelligence Consultant ??

5 Min Read
Exciting Predictions For Where Big Data Analytics Are Headed By 2025
AnalyticsBig DataExclusive

Exciting Predictions For Where Big Data Analytics Are Headed By 2025

8 Min Read
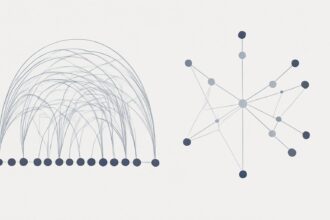
Visualizing Networks in R: Arc Diagrams and Hive Plots
Modeling

Visualizing Networks in R: Arc Diagrams and Hive Plots

3 Min Read

SmartData Collective is one of the largest & trusted community covering technical content about Big Data, BI, Cloud, Analytics, Artificial Intelligence, IoT & more.

AI chatbots
AI Chatbots Can Help Retailers Convert Live Broadcast Viewers into Sales!
Chatbots
ai chatbot
How AI Website Chatbots Improve Customer Support and Lead Generation
Chatbots Exclusive

Quick Link

  • About
  • Contact
  • Privacy
Follow US
© 2008-26 SmartData Collective. All Rights Reserved.
Welcome Back!

Sign in to your account

Username or Email Address
Password

Lost your password?