Benchmark & compare your WordPress Blog – How good are you? – My ComMetrics
Benchmark & compare your WordPress Blog – How good are you? – My ComMetrics
Do you know how best to manage big data for your organization?
1. Business analytics: Best practices for success (October 2, 2012 – you are here)
2. Business analytics: Raise your hand if you hate statistics (November 12, 2012)
3. Business analytics: Raise your hand if you hate research (January 13, 2012)

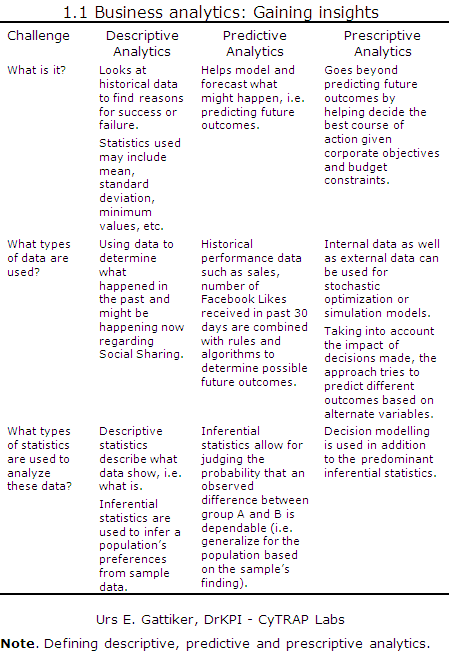
As Table 1.1 suggests, there are three types of business analytics:
- descriptive analytics – looking at historical data,
- predictive analytics – trying to predict what might happen, and
- prescriptive analytics – focusing on providing different options.
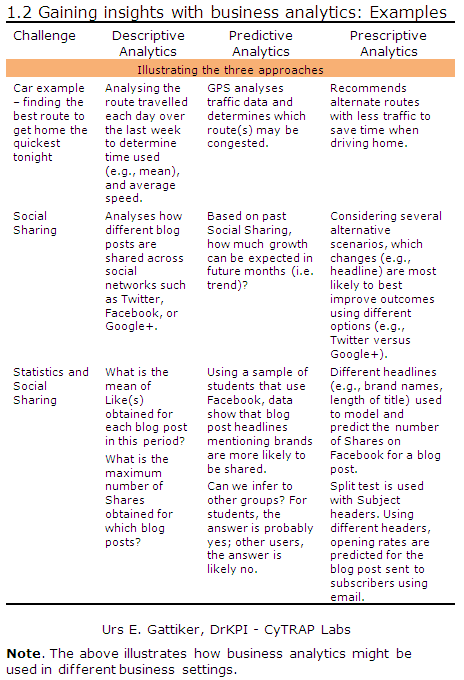
Table 1.2 illustrates the above concepts by providing examples.
In prescriptive analytics the data used by the GPS might feed into another program, which calculates several alternatives regarding the route and time one should leave the office in the evening to get home the quickest (between 16:00 and 17:00 versus 18:00 and 18:30).
By the way, sign up for our blog – it is FREE! Get the next two installments of this series first.
Inferential statistics – what’s that?
Inferential statistics entail drawing conclusion about a parameter (e.g., industry a client works in) from the sample (e.g., of clients) to the population (all clients). However, the sample must be representative of the population for acurracy.
If our data are normally distributed, parametric statistics might be used but if the variables used are not normally distributed, non-parametric statistics must be used.
Below we define these approaches.
Source: Business Analytics – by DrKPI – My.ComMetrics – CyTRAP – Business analytics: Gaining insights
Use the above table “Business analytics: Gaining insights” on your blog: Just copy the code in the box below and paste it in a post!
Of course, good practice or best practice is an important criteria that we need to address when deciding what type of analyses we want to use. Nevertheless, to understand the subtle differences it is necessary to present some examples illustrating descriptive, predictive and prescriptive analytics.
We can describe descriptive analysis as trying to find out how much time it took us on average (mean) to commute home during last month (see first example in Table 1.2). To illustrate how to apply the predictive analytics framework, we may use our on-board GPS. It might be able to tell us which route to take when getting ready to leave the office to drive home (just imagine gridlocked traffic during rush hour in Los Angeles).
Source: Business Analytics – by DrKPI – My.ComMetrics – CyTRAP – Gaining insights with business analytics: Examples
Use the above table “Gaining insights with business analytics: Examples” on your blog: Just copy the code in the box below and paste it in a post!
Source: Business analytics: Examples Illustrating three methods with examples
Conclusion
The best way to get things going is to review the existing or as-is state. Successful business analysis regarding social media activities or social sharing requires the formalization of a common vision, a tuned methodology, and a common set of tools that help reduce risks, control costs, and improve performance.
The next step after the above inventory is to build a vision about how business analysis could work when doing social media marketing. For this purpose we have presented the business analysis framework and what methodology would be used.
Tables 1.1 and 1.2 show that business analysis approaches are driven by different challenges that await solutions. As the follow-up presentations will show (e.g., Raise your hand if you hate statistics), when the wrong type of data is collected or inappropriate statistical tools are used, the best methodology does not provide you with the insight you need to make the right decisions.
More resources about Likert scales, parametric statistics, missing values, methodology, etc.
– Hoskin, Tanya (not dated) Parametric and nonparametric: Demystifying the terms. Rochester: Working paper, Mayo Clinic. Retrieved September 28, 2012, from http://www.mayo.edu/mayo-edu-docs/center-for-translational-science-activities-documents/berd-5-6.pdf
– How raw data are normalized
– Are Google and Yahoo failures?
– What about missing values?
– Social Media Audit: Measure for Impact
– Big data – methodology, research, statistics and parametrics… (just click the URL to query and get some very interesting results – more ComMetrics content).
As always, I look forward to reading your thoughts and comments below!

The author: This post was written by social media marketing and strategy expert Urs E. Gattiker, who also writes about issues that connect social media with compliance, and thrives on the challenge of measuring how it all affects your bottom line.
His latest book, Social Media Audit: Measure for Impact, will appear in October, 2012 from Springer Science Publishers.
Connect with ComMetrics on Google+ or the author using: Email | Twitter | Google+ | Xing