We use cookies, including third-party cookies from Google to serve personalized ads through AdSense, to operate this site and understand how it is used. By continuing to browse, you accept this use. See our Privacy Policy and Terms of Use for details, including how to opt out of personalized advertising.
Accept
SmartData CollectiveSmartData Collective
  • Analytics
    AnalyticsShow More
    chatgpt image jul 21, 2026, 04 34 30 pm
    4 Core Benefits of Predictive Maintenance after Vibration Analysis
    10 Min Read
    How Does Data Mining Boost Customer Satisfaction in Logistics? Harnessing Analytics for Results -- AI-generated illustration
    How Does Data Mining Boost Customer Satisfaction in Logistics? Harnessing Analytics for Results
    11 Min Read
    chatgpt image jul 13, 2026, 04 23 45 pm
    How Data Analytics Helps Companies Improve User Engagement
    19 Min Read
    chatgpt image jul 13, 2026, 03 59 46 pm
    How Data Analytics Improves Multi-Location Search Strategies
    10 Min Read
    cybersecurity efforts
    How Behavioral Analytics and AI Are Redefining Cybersecurity for Boca Raton Businesses
    14 Min Read
  • Big Data
  • BI
  • Exclusive
  • IT
  • Marketing
  • Software
Search
© 2008-25 SmartData Collective. All Rights Reserved.
Reading: Apple Products on Twitter – A Text Analytics Example
Share
Notification
Font ResizerAa
SmartData CollectiveSmartData Collective
Font ResizerAa
Search
  • About
  • Help
  • Privacy
Follow US
© 2008-23 SmartData Collective. All Rights Reserved.
SmartData Collective > Analytics > Text Analytics > Apple Products on Twitter – A Text Analytics Example
AnalyticsText Analytics

Apple Products on Twitter – A Text Analytics Example

ThemosKalafatis
ThemosKalafatis
2 Min Read
Apple Products on Twitter - A Text Analytics Example
Illustration generated with FLUX.2 [klein 4B] via Cloudflare Workers AI.
SHARE
 
 
My presentation on the 7th annual text analytics summit was a tutorial in one of the methodologies one could use to analyze unstructured text. The sample consisted of 365000 tweets that contained keywords of Apple products and concepts such as iPad, iPhone, iPod, Apple Store, Mac, Steve Jobs and the goal was to get an understanding of what people where tweeting about each product or concept.
The first step is to use a text analysis toolkit (i used GATE) to annotate the tweets and identify which concepts and keywords occur within the tweets. But this is not always easy. Take the word Mac for example. According to the context, Mac could be a computer type,  a burger type, the MAC beauty products or Mac Arthur airport. So when a query sent to Twitter API that contains the word  Mac we end up with lots of erroneous information.
So one of the things that have to be done to ensure good results  is word sense disambiguation. We know for example that if a tweet contains a word such as fries, lettuce and/or salad then quite likely the word Mac that was also found within this tweet was about the Big Mac (even though the word Big may not be present). If we find the word Arthur next to the word Mac then the tweet is about the Mac Arthur airport, etc. Here is GATE in action, identifying different keywords and concepts in Tweets :

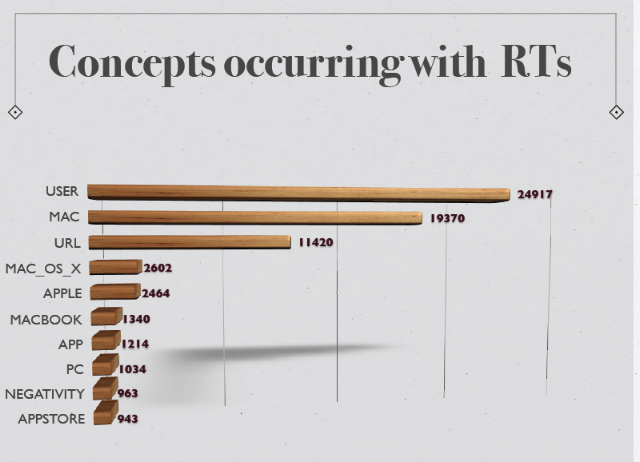
Now we can see which concepts and keywords appear frequently in Re-Tweets (‘USER’ denotes that a ‘@’ was present in the Tweet, ‘URL’ that a URL link was found in the Tweet,etc)
 We can also see which words frequently occur with iPhone5 :


Share This Article
Facebook Pinterest LinkedIn
Share

Follow us on Facebook

Latest News

8 MCP Tools for Market and Consumer Intelligence Workflows -- AI-generated illustration
8 MCP Tools for Market and Consumer Intelligence Workflows
Artificial Intelligence Exclusive
How Local Service Businesses Can Map Which Neighborhoods Generate the Most Revenue -- AI-generated illustration
How Local Service Businesses Can Map Which Neighborhoods Generate the Most Revenue
Business Intelligence
Best VMware Alternatives in Thailand for Private Cloud and HCI Deployments -- AI-generated illustration
Best VMware Alternatives in Thailand for Private Cloud and HCI Deployments
Cloud Computing Exclusive IT
Using Safety Metrics and Incident Data to Reduce Construction Risk and Insurance Costs -- AI-generated illustration
Using Safety Metrics and Incident Data to Reduce Construction Risk and Insurance Costs
Big Data Exclusive

Stay Connected

1.2KFollowersLike
33.7KFollowersFollow
222FollowersPin

You Might also Like

Analytics for Emotional Examination?
Analytics

Analytics for Emotional Examination?

4 Min Read
Landscape:  Data Warehousing and Business Analytics
AnalyticsData Warehousing

Landscape: Data Warehousing and Business Analytics

5 Min Read
Risk and Five Sigma Events – Can They Happen to You?
Business IntelligenceCulture/LeadershipModelingPolicy and GovernancePredictive AnalyticsRisk Management

Risk and Five Sigma Events – Can They Happen to You?

5 Min Read
Agriculture Industry
AnalyticsBig Data

Big Data Revolution in Agriculture Industry: Opportunities and Challenges

5 Min Read

SmartData Collective is one of the largest & trusted community covering technical content about Big Data, BI, Cloud, Analytics, Artificial Intelligence, IoT & more.

From Bolts to Bots: How AI Is Fortifying the Automotive Industry
Artificial Intelligence
ai chatbot
How AI Website Chatbots Improve Customer Support and Lead Generation
Chatbots Exclusive

Quick Link

  • About
  • Contact
  • Privacy
Follow US
© 2008-26 SmartData Collective. All Rights Reserved.
Welcome Back!

Sign in to your account

Username or Email Address
Password

Lost your password?