There are a few different, and sometimes opposing forces in analytics software which make the process of evaluating, purchasing, implementing and using BI software products a complex process. The rapid pace of unstructured and structured data growth in many companies requires a reporting system which is sophisticated and powerful for:

There are a few different, and sometimes opposing forces in analytics software which make the process of evaluating, purchasing, implementing and using BI software products a complex process. The rapid pace of unstructured and structured data growth in many companies requires a reporting system which is sophisticated and powerful for:
- Data mining for classification of information and understanding trends
- Data processing for information integrity/data quality
- Predictive analytics to forecast future performance
- Able to extract information from multiple data sources, and normalize/rationalize it accordingly
- Identifying anomalies and providing diagnostics as to what might be going wrong
The systems that can generate this sort of reporting have historically been quite complex and required the intervention or involvement of IT staff or data scientists. Top tier business intelligence software vendors like SAP/Business Objects, IBM Cognos and Oracle have been leading solutions for complex analytics requirements like these, which are costlier to license and manage, and require specialized skill sets for management and report generation.
Does your company need to train/hire data scientists?
The reporting capabilities of high end, on-premises reporting systems are impressive, though many companies have struggled to get strong returns from business intelligence software. The ramp up time for self-directed online training and classroom administrative training for a system like Cognos is time-consuming and requires a foundation of technical understanding.
Cloud application integration is also less complex, and pre-built integration plug-ins help to make reporting possible without demanding a lot of time from IT personnel. API standardization has come a long way to eliminate a lot of coding, which accelerates implementation and adoption of the BI engine.
Data Visualization and Presentation Tools
For non-technical managers looking for an executive dashboard view of their own department, or company-wide, data visualization apps are an affordable and simplified way to produce reports without extensive training. Leading self-service BI tools like Microsoft Power BI, Tableau and Qlik give business executives the power to easily define the parameters of a report, and then schedule it to run when needed.
Complex spreadsheets and pivot tables were the bane of the existence of many a knowledge worker or manager in the past. That said, many data visualization systems still use spreadsheet apps like Microsoft Excel or Google Sheets as the presentation layer for reports and dashboards, even if the data is being pulled from multiple sources like financial systems, CRM, and/or web content analytics.
Instead of having to wait for a database specialist to make time for generating a custom report, non-technical employees can use data viz systems to see custom views of pre-built reports. If a manager has to present to his or her team, or a CFO needs to present to their Board of Directors, presentation slide decks can have embedded reports pulling the latest performance numbers.
Reports for Mobile Professionals
If you’ve ever struggled to present complex information to a group of customers or potential investors in the field, the ease of data visualization apps will be a welcome change. Using your tablet or mobile phone to show your company’s sales forecast during a coffee meeting is easier than scrolling through a complex set of numbers. Apps like Domo provide instant messaging between colleagues to enable a further understanding of charts, graphs and the data they represent.
Machine Learning and Data Visualization
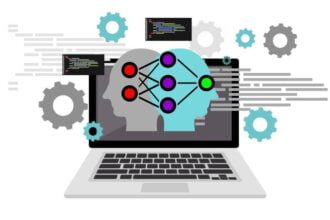
In some cases, machine learning and cognitive computing systems have moved the complexity of BI from the data scientists to the software itself. A clinical research technician might benefit from a system like IBM Watson which can take care of a lot of the “heavy lifting” of searching local and publicly available data to classify potential tests and remedies for a patient based on other patient cases.
Business intelligence solutions in the market today enable business professionals to stay focussed on building and maintaining their industry expertise, without needing to become a BI expert. Years ago, analysts could spend days, weeks or months to understand how to build reports and be able to understand what they represent. Now, many apps can be learned within a few hours, or even less for those using existing reports on mobile apps.
If your organization is struggling with making sense of your data and learning how to use the reporting systems which have been adopted over time, it’s likely time to take a look at alternative data visualization/reporting applications. A common challenge for many companies that have adopted analytics in the past has been providing self-service access to reports to free up IT from having to get business executives their data.
Finding a user-friendly analytics application that is compatible with your company’s existing cloud applications takes time and financial investment. A short ramp-up time on generating reports and tailoring them for presentation ensures the payoff is well worth the effort.


