
We use cookies, including third-party cookies from Google to serve personalized ads through AdSense, to operate this site and understand how it is used. By continuing to browse, you accept this use. See our Privacy Policy and Terms of Use for details, including how to opt out of personalized advertising.
Accept
SmartData CollectiveSmartData Collective
  • Analytics
    AnalyticsShow More
    chatgpt image jul 21, 2026, 04 34 30 pm
    4 Core Benefits of Predictive Maintenance after Vibration Analysis
    10 Min Read
    How Does Data Mining Boost Customer Satisfaction in Logistics? Harnessing Analytics for Results -- AI-generated illustration
    How Does Data Mining Boost Customer Satisfaction in Logistics? Harnessing Analytics for Results
    11 Min Read
    chatgpt image jul 13, 2026, 04 23 45 pm
    How Data Analytics Helps Companies Improve User Engagement
    19 Min Read
    chatgpt image jul 13, 2026, 03 59 46 pm
    How Data Analytics Improves Multi-Location Search Strategies
    10 Min Read
    cybersecurity efforts
    How Behavioral Analytics and AI Are Redefining Cybersecurity for Boca Raton Businesses
    14 Min Read
  • Big Data
  • BI
  • Exclusive
  • IT
  • Marketing
  • Software
Search
© 2008-25 SmartData Collective. All Rights Reserved.
Reading: Spreadsheets: Still the King of Business Intelligence Tools
Share
Notification
Font ResizerAa
SmartData CollectiveSmartData Collective
Font ResizerAa
Search
  • About
  • Help
  • Privacy
Follow US
© 2008-23 SmartData Collective. All Rights Reserved.
SmartData Collective > Software > SQL > Spreadsheets: Still the King of Business Intelligence Tools
AnalyticsBig DataBusiness IntelligenceData ManagementITSoftwareSQLStatistics

Spreadsheets: Still the King of Business Intelligence Tools

raqsoft
raqsoft
4 Min Read
Spreadsheets: Still the King of Business Intelligence Tools
Illustration generated with Qwen Image.
SHARE

“BI is not an upgrade to the spreadsheet!” “Stop trying to use the spreadsheet as a BI tool!” BI vendors are frequently heard to make such comments.

“BI is not an upgrade to the spreadsheet!” “Stop trying to use the spreadsheet as a BI tool!” BI vendors are frequently heard to make such comments. People may thus assume that the spreadsheet is on the decline, and feel embarrassed by their Microsoft Excel, RaqSoft esCalc, LibreOffice Calc, and OpenOffice Calc tools because they may have a wrong impression that these tools are not intelligent enough to cross the BI threshold. The technology consulting firm Gartner Group Inc. once precisely predicted that BI would be the hottest technology in 2012. The year of 2012 witnessed a sharp and substantial increase of BI. Unexpectedly, the spreadsheet turns out to be the one developed and welcomed most, instead of the SAP BusinessObjects, IBM Cognos, QlikTech Qlikview, MicroStrateg, or TIBCO Spotfire. In fact, whether it is in the aspect of total sales, customer base, or the increment, the spreadsheet is the top one.

Why is the spreadsheet still ruling the BI world?

One of the key factors is its low technical requirement. The spreadsheet does not require a complex installation and deployment procedure or expertise in SQL/MDX/Java script/.Net, let alone a great many of advisory agents and technical experts to give you command. The spreadsheet is so simple and easy to learn that even the “100 Compulsory Things to Do for U.S. Pupils in Summer Holiday” includes the homework of presenting data in Excel to their parents. These are just the drawbacks of the non-spreadsheet BI tools – their technical requirements are usually too high.

More Read
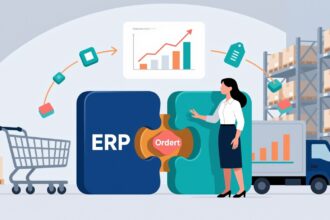
ERP Integration Benefits Data-Savvy eCommerce for Distribution Industry
3 Ways Automation Tools Use Big Data To Drive Business Growth
Saving Money and Lives With Predictive Maintenance
Who should Jean-Claude Trichet call?
How Data-Driven Journalists Are Using API News Apps to Improve Reporting

Being intuitive, free, and flexible are also factors.  Simple actions like query, filtering, grouping, sorting, formula composing, and judging are the routine work common and understandable to everyone. The free combination of these operations can bring about numerous algorithms. However, the non-spreadsheet BI tools are all hard to understand, and restrictive to your innovative ideas. Just to name a few, you can only calculate in the model of the respective BI tool and must have an idea of the rotation of dimensions.

Most importantly, the spreadsheet is business-personnel-oriented. What is the purpose of BI? BI is aimed to enhance enterprise competiveness through business computing. This objective requires the business personnel to carry out the analysis from the business perspective when confronting to the business opportunities and risks. However, the non-spreadsheet BI tools are designed for IT experts. They may know the SQL and linear regression, and are able to solve 20% of BI problems, but they may not necessarily know the business.

It is the low technical requirement, intuitive and flexible calculation capability, and business-expert-oriented easy solution to the other 80% of BI problems that makes the spreadsheet still rule the BI world.

(image: spreadsheets and BI / shutterstock)

TAGGED:spreadsheets
Share This Article
Facebook Pinterest LinkedIn
Share

Follow us on Facebook

Latest News

Analyst points at colorful circular data dashboard on screen - information technology business metrics
How Fragmented Workplace Tech Undermines Reliable Business Metrics and Reporting
Cloud Computing Exclusive Infographic IT
Using Multi-Source Data and Analytics to Detect Operational Drift Across Franchise Networks -- AI-generated illustration
Using Multi-Source Data and Analytics to Detect Operational Drift Across Franchise Networks
Exclusive Infographic
Beyond The First Impression: The Long-Lasting Impact Of Sensory Marketing -- AI-generated illustration
Beyond The First Impression: The Long-Lasting Impact Of Sensory Marketing
Infographic Marketing
The Infrastructure Gap Slowing Data Center Growth -- AI-generated illustration
The Infrastructure Gap Slowing Data Center Growth
Big Data Cloud Computing Exclusive Infographic IT

Stay Connected

1.2KFollowersLike
33.7KFollowersFollow
222FollowersPin

You Might also Like

Big Data Is More Valuable with Kapow
Big DataBusiness IntelligenceSoftware

Big Data Is More Valuable with Kapow

6 Min Read
Don't Gloat Over Excel Model Failures
AnalyticsCommentaryCulture/LeadershipNewsStatistics

Don’t Gloat Over Excel Model Failures

6 Min Read
Spreadsheets: Use Them, Don't Abuse Them
AnalyticsBest PracticesBig DataData ManagementWorkforce AnalyticsWorkforce Data

Spreadsheets: Use Them, Don’t Abuse Them

10 Min Read
Spice Up Your Spreadsheets: Boosting BI with Google Spreadsheets
Uncategorized

Spice Up Your Spreadsheets: Boosting BI with Google Spreadsheets

8 Min Read

SmartData Collective is one of the largest & trusted community covering technical content about Big Data, BI, Cloud, Analytics, Artificial Intelligence, IoT & more.

AI chatbots
AI Chatbots Can Help Retailers Convert Live Broadcast Viewers into Sales!
Chatbots
ai chatbot
How AI Website Chatbots Improve Customer Support and Lead Generation
Chatbots Exclusive

Quick Link

  • About
  • Contact
  • Privacy
Follow US
© 2008-26 SmartData Collective. All Rights Reserved.
Welcome Back!

Sign in to your account

Username or Email Address
Password

Lost your password?