Cookies help us display personalized product recommendations and ensure you have great shopping experience.

By using this site, you agree to the Privacy Policy and Terms of Use.
Accept
SmartData CollectiveSmartData Collective
  • Analytics
    AnalyticsShow More
    data analytics for pharmacy trends
    How Data Analytics Is Tracking Trends in the Pharmacy Industry
    5 Min Read
    car expense data analytics
    Data Analytics for Smarter Vehicle Expense Management
    10 Min Read
    image fx (60)
    Data Analytics Driving the Modern E-commerce Warehouse
    13 Min Read
    big data analytics in transporation
    Turning Data Into Decisions: How Analytics Improves Transportation Strategy
    3 Min Read
    sales and data analytics
    How Data Analytics Improves Lead Management and Sales Results
    9 Min Read
  • Big Data
  • BI
  • Exclusive
  • IT
  • Marketing
  • Software
Search
© 2008-25 SmartData Collective. All Rights Reserved.
Reading: Analytics: Frequency Distribution & Bell Curves
Share
Notification
Font ResizerAa
SmartData CollectiveSmartData Collective
Font ResizerAa
Search
  • About
  • Help
  • Privacy
Follow US
© 2008-23 SmartData Collective. All Rights Reserved.
SmartData Collective > Analytics > Predictive Analytics > Analytics: Frequency Distribution & Bell Curves
Predictive Analytics

Analytics: Frequency Distribution & Bell Curves

Editor SDC
Editor SDC
4 Min Read
SHARE

A statistical method we often overlook is the distribution curve.  I think most of the time it is dismissed because people get nervous about using statistics if they are comfortable with math.  While there are some advanced concepts around using a frequency curve, it can also be used visually as a simple tool to explain results.

A simple stats lesson….

A statistical method we often overlook is the distribution curve.  I think most of the time it is dismissed because people get nervous about using statistics if they are comfortable with math.  While there are some advanced concepts around using a frequency curve, it can also be used visually as a simple tool to explain results.

More Read

Three Sites to Check Out for Business Analytics Info
Big Data Is Nothing Without Its Little Brother
The Netflix Prize, Occam’s Razor and PMML
We Need A Smarter Grid
Why Business Analytics is important for business more than ever NOW !!

A simple stats lesson….

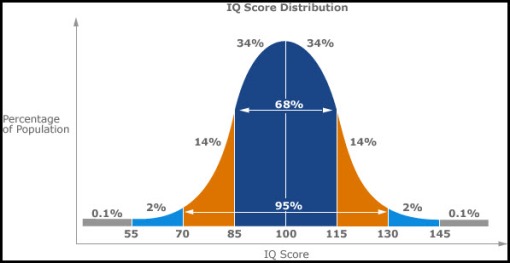
Normal Bell Curve – roughly 68% of the population is within 1 standard deviation (measure of variation) of the average and 95% is within two standard deviations. Below is an example of IQ scores.  The average score is 100 and 68% of the data is between 85 & 115.

While this visualization doesn’t do a tremendous amount for us, this is what we assume when we think of populations, like customers and employees.  And because of our limited statistical training we make a large number of assumptions based on averages.  We love to look at average revenue: average revenue per employee, average revenue per customer, etc.  This thinking also gets us looking into the outliers (that <5% that sits way out to the left or right of the chart).  How much time do you spend on less than 5% of the business?


OK, so back to thinking of this in terms of running a business….

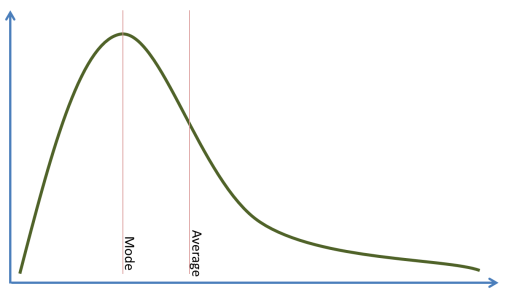
Let’s map out our revenue per customer.  I would be willing to bet it looks something like the following:

If this is the customer revenue distribution, if we use the average number in our analyzes we can quickly generate a number of wrong assumptions.  First and foremost, our typical customer is larger than reality.  It might lead us to think we are serving mid-sized businesses than more likely smaller market customers.  I am also willing to bet our profitability per customer has a similar curve to it.  In this case we are likely spending money on the wrong customers and aligning our better services to a lower profit generating customer (or more likely a profit destroying customer).

Do we need to use it in everything? Of course not, but it might help everyone once in a while to challenge our overuse of the mathematical average to reassess perspectives of our business.  A great place to start is map out the customer base in terms of revenue (profitability is better, but takes a lot longer to do).  It might just lead you to understand your customer (think customer segmentation) better.

Real life example…I was once part of a research project to understand discounting to one side of the outliers (<1% of the business).  The outcome was to focus on reducing discounting to that <1% of the business.  What I argued was to focus on the larger part of the business, where the same efforts would have resulted in millions more in terms of profits.  It was a clear lesson is where to apply process improvement.

Share This Article
Facebook Pinterest LinkedIn
Share

Follow us on Facebook

Latest News

payment methods
How Data Analytics Is Transforming eCommerce Payments
Business Intelligence
cybersecurity essentials
Cybersecurity Essentials For Customer-Facing Platforms
Exclusive Infographic IT Security
ai for making lyric videos
How AI Is Revolutionizing Lyric Video Creation
Artificial Intelligence Exclusive
intersection of data and patient care
How Healthcare Careers Are Expanding at the Intersection of Data and Patient Care
Big Data Exclusive

Stay Connected

1.2kFollowersLike
33.7kFollowersFollow
222FollowersPin

You Might also Like

Technologies and Analyses in CBS’ Person of Interest

6 Min Read
Hadoop in manufacturing
AnalyticsBig DataCloud ComputingHadoopHardwareITMapReduceModelingOpen SourcePredictive AnalyticsSentiment AnalyticsSocial Media AnalyticsSoftwareSQLUnstructured DataWeb AnalyticsWorkforce Analytics

Fine-Tuning Manufacturing Operations with Big Data and Hadoop

6 Min Read

The Perils of Forecasting Benchmarks

3 Min Read

Hospitality Technology (Or Lack Thereof) – What is the Insight ROI?

3 Min Read

SmartData Collective is one of the largest & trusted community covering technical content about Big Data, BI, Cloud, Analytics, Artificial Intelligence, IoT & more.

data-driven web design
5 Great Tips for Using Data Analytics for Website UX
Big Data
giveaway chatbots
How To Get An Award Winning Giveaway Bot
Big Data Chatbots Exclusive

Quick Link

  • About
  • Contact
  • Privacy
Follow US
© 2008-25 SmartData Collective. All Rights Reserved.
Go to mobile version
Welcome Back!

Sign in to your account

Username or Email Address
Password

Lost your password?