

Data analytics technology has become an integral part of organizational management. This is a topic that MQ Shabbir addressed in a study that was published in Springer Open last year.
There are a lot of different ways that big data can help companies streamline certain processes and resolve various challenges that they face. The advent of data visualization has made it easier than ever. It just one of the many ways that data analytics is helping optimize organizational processes.
The global market for data visualization services is expected to be worth over $5 billion by 2026. This figure is going to keep growing as more companies discover the benefits of various data visualization tools.
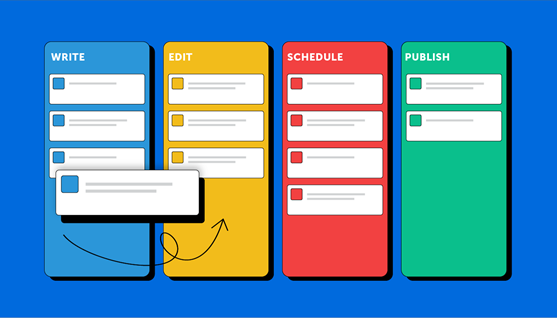
One of the ways that companies can use data visualization is by integrating it with Kanban boards. This is a creative way to help navigate various issues your company will face.

Using Kanban Boards with Data Analytics Technology
Kanban is one of the best business intelligence solutions on the market. You can find a number of useful ways to use kanban boards with big data. Keep reading to see this in practice.
Examples of kanban boards are a great source of inspiration for building and improving your boards. By examining how other companies use the Kanban boards to outline workflows, you can improve your board design, perform more excellent modes such as WIP restrictions and process policies, and acquire more power from your Kanban boards. You can often integrate data visualization technology to get a more interactive and communicative interface.
You’ll find similar points about how other teams are building boards and tracking work with data analytics tools. However, just as your team has distinctions that differ from other groups, your Kanban board also has nuances that differ from these examples.
Development Team Kanban Board Example
The software development team has adopted the Kanban system from the earliest. Here are three standards of how the advancement team practices the Kanban board with data analytics tools to maintain parallel processes, improve pull systems applying the “Ready” queue, and implement WIP restrictions.
Data visualization of concurrent processes
Some teams may have several processes in parallel that are closely related but are so different that they require their workflows. For example, an advancement team may need to track feature development and testing.
Rather than simplify the process steps to meet the needs of both processes in a single workflow, teams can use horizontal swim lanes to design boards to track both approaches in parallel.
Enhance pull systems with ready queues
Examples of kanban boards are a great source of inspiration for building and improving your boards. Examining how other organizations leverage Kanban boards to plan their workflows will benefit you by enhancing your board layout, performing more excellent modes such as WIP restrictions and process management, and acquiring more power from your Kanban boards.
Like this Kanban board example, queuing data and “ready” matrices can be incorporated into the board design, allowing the team to understand their work in the process better. By adding “In Progress” and “Completed” sub lanes within the Development mark, the team can recognize which work details are actively being managed, which work items have been developed but not yet started testing, and which work things are actually in the testing stage.
Instead of pushing work items into a “test” lane, developers can put them in a “ready” queue and then pull them into the appropriate route when testers are ready to start testing.
Implementing WIP Limits
In-Process (WIP) limitations are another important cancer concept that helps all teams, including development teams and data scientists, actively manage the flow of work within the system.
The development team uses WIP limits to limit the number of tasks in a particular lane expressly. Not all routes have WIP limits (indicated by numbers in the upper right of the lane title). It is a step that the team has determined is likely to put a strain on the system. It is whether the team’s ability to complete that step is limited or the task itself is intrinsically complex (or a combination of these two factors).
Passive visualization of WIP limits is helpful, but only if the limits are respected. With online Kanban boards that enforce limitations, like this example of a kanban board, your team is more likely to notice when WIP limits are met or exceeded.
Data Visualization is Fundamental to Using Kanban Boards for Organizational Management
By using data visualization with your Kanban boards, the team can communicate priority conflicts, identify solutions, and reclaim the flow of work. Examples of Kanban Boards for Different Operations Teams show how teams can manage different types of demand, visualize changing priorities, and bring everyone together while reflecting the expertise of team members.


