
This OBIEE training tutorial will show you the basic steps required to build an Oracle OBIEE dashboard. By building on these principles you will be able to create dashboards to meet the specific needs of your users and to give you instant oversight of your business data.
Pre-requisites
Before you can build a dashboard, you will need:
This OBIEE training tutorial will show you the basic steps required to build an Oracle OBIEE dashboard. By building on these principles you will be able to create dashboards to meet the specific needs of your users and to give you instant oversight of your business data.
More Read

Pre-requisites
Before you can build a dashboard, you will need:
- A correctly configured and operational Oracle database.
- A correctly installed and configured instance of the Oracle OBIEE analytical tools.
- A user name and password with the correct permissions to access and use the OBIEE tools.
With these in place, you will be able to start building dashboards.
Creating an OBIEE dashboard
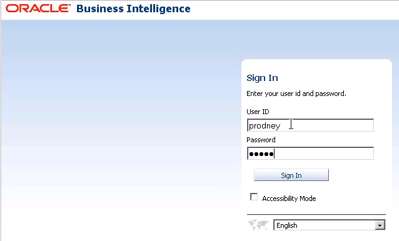
- Access your OBI analytics installation and login using your credentials – you may need to speak to your systems administrator for this information.

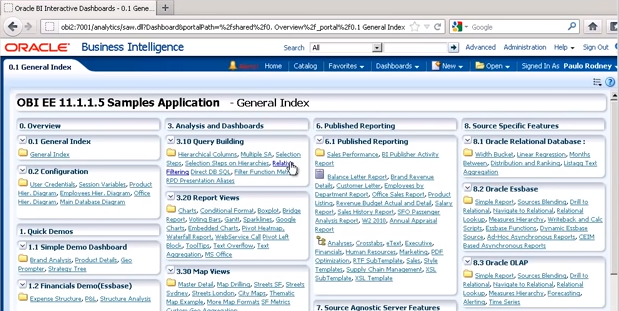
- Once logged in, you will immediately see the default dashboard for your user profile.

- Click the Catalog menu item at the top to define where the new dashboard will be created

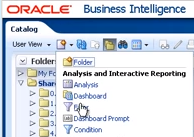
- In the Catalog view, highlight Shared Folders in the Folders tree view on the left of the screen. Then click the New button, selecting Folder from the drop-down menu:

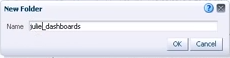
You will then need to give the new folder a name. Because this will be a shared folder that is viewable by other users (based on their permission levels), make sure you choose something suitable descriptive:

Click OK to create the folder.
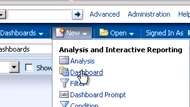
- Highlight the newly created folder in the tree navigation pane (called julie_dashboards in this example) and then click New -> Dashboard from the top menu bar:

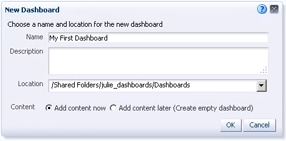
- Complete the New Dashboard dialog box supplying a name for the dashboard and also a description (if appropriate):

Note that in the Location drop-down, OBI has automatically created a subfolder called Dashboards under the new folder created in step 4.
Leave the Add content now radio button selected and click OK.
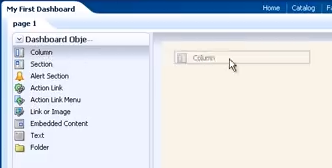
- The screen will refresh, presenting you with a blank dashboard ready for you start dropping content on to it. Click and drag Column from the Dashboard objects pane and drop it onto the canvas in the main section of the screen:

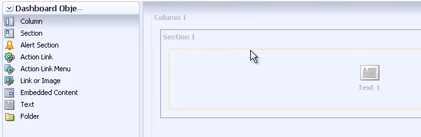
Repeat the process, this time dragging the Text option into the new Column 1 section on the canvas:

You will see that this automatically creates a new section (Section 1).
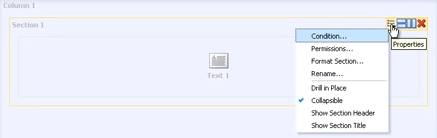
- You can now amend the properties of the section by clicking the Properties button. Select Show Section Title from the context menu:

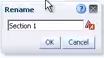
Use the same button and select Rename… to give Section 1 a more meaningful title:

In our example we called it My First Dashboard. Click OK to apply the change.
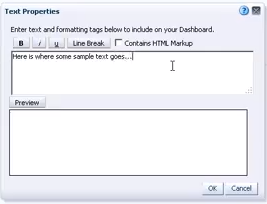
- Click the text item on the dashboard followed by the Properties button. You can use this dialog to change the text displayed on your dashboard:

Clicking the Contains HTML Markup checkbox allows you to enter most standard HTML tags, giving you greater control over the formatting of the text. When you’re done, click Preview (to check your changes) followed by OK to save them.
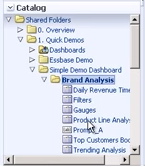
- The same drag-and-drop principles apply for other objects. locate the Product Line Analysis analysis item under Shared Folders -> 1. Quick Demos -> Simple Demo Dashboard -> Brand Analysis in the bottom-left Catalog pane.

Then simply drag it onto the main dashboard pane as before. Click the Save button at the top of the screen to apply your changes.
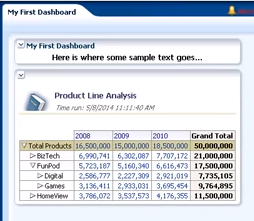
- Click Run. When the screen reloads you should see your new dashboard as below:

Note that the analysis added in the previous step is pulling through live data from the Oracle database.
Modifying the OBIEE dashboard design
With the dashboard complete, you will notice that the sections added are both collapsible. You can however force them to remain open at all times by:
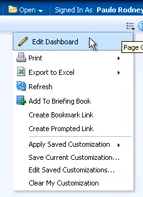
- Click the Properties button in the top right hand corner of the screen and select Edit Dashboard:

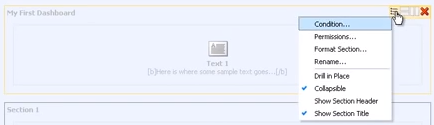
- When the dashboard design screen loads up, click the Properties button next to the section you want to fix open and uncheck Collapsible:

Repeat for any other sections you want to force open, then click Save and then Run.
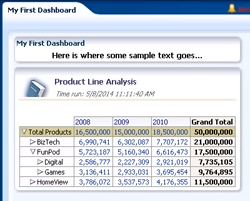
- You will now see that the collapse option has disappeared for each of the edited sections:

And that is pretty much all there is to creating very basic OBIEE dashboards. This is covered in great detail in Firebox Training’s instructor-led OBIEE training course. You can find a video version of this OBIEE dashboard creation tutorial on our YouTube channel.


