We use cookies, including third-party cookies from Google to serve personalized ads through AdSense, to operate this site and understand how it is used. By continuing to browse, you accept this use. See our Privacy Policy and Terms of Use for details, including how to opt out of personalized advertising.
Accept
SmartData CollectiveSmartData Collective
  • Analytics
    AnalyticsShow More
    chatgpt image jul 21, 2026, 04 34 30 pm
    4 Core Benefits of Predictive Maintenance after Vibration Analysis
    10 Min Read
    How Does Data Mining Boost Customer Satisfaction in Logistics? Harnessing Analytics for Results -- AI-generated illustration
    How Does Data Mining Boost Customer Satisfaction in Logistics? Harnessing Analytics for Results
    11 Min Read
    chatgpt image jul 13, 2026, 04 23 45 pm
    How Data Analytics Helps Companies Improve User Engagement
    19 Min Read
    chatgpt image jul 13, 2026, 03 59 46 pm
    How Data Analytics Improves Multi-Location Search Strategies
    10 Min Read
    cybersecurity efforts
    How Behavioral Analytics and AI Are Redefining Cybersecurity for Boca Raton Businesses
    14 Min Read
  • Big Data
  • BI
  • Exclusive
  • IT
  • Marketing
  • Software
Search
© 2008-25 SmartData Collective. All Rights Reserved.
Reading: People, Process, and Technology
Share
Notification
Font ResizerAa
SmartData CollectiveSmartData Collective
Font ResizerAa
Search
  • About
  • Help
  • Privacy
Follow US
© 2008-23 SmartData Collective. All Rights Reserved.
SmartData Collective > Uncategorized > People, Process, and Technology
Uncategorized

People, Process, and Technology

Editor SDC
Editor SDC
3 Min Read
People, Process, and Technology
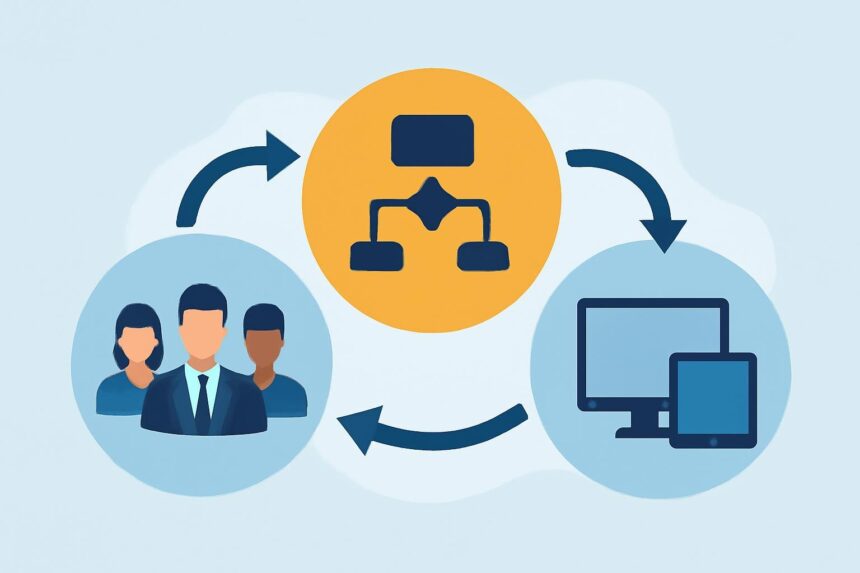
Illustrative image generated with OpenAI gpt-image-1.
SHARE

In every BI vendor’s marketing material is the traditional People, Process, Technology venn diagram. The promise is that leveraging the combination of the three will unlock enhanced results.

In order to use this for performance management, we need to rethink the original design. First we need a vision on how to bring these together and communicate what matters and how it will be done. We also need to bring a focus on getting only the right things done and specifically not doing the wrong things. Words (and diagrams) do little in terms of actions. For us to achieve sustained performance, we need to understand and communicate which processes can create value (and which do not), what technology it will require, and a focused management process to ensure they get done in a timely manner.

Venn New

As you design your game plans, you need to make sure you are developing not only a plan but how success will be defined:

More Read

Fight Hunger on April Food Day
Twinterview – Interviewed about Twitter via Twitter
Would You Prefer Prettier Pivot Tables?
Is Nepotism Undermining Your Business Technology Innovation?
Is having SOA and Master Data Management at the same time a form of overkill?
  • What is the desired outcome?
  • Who gets to define it?
  • How will it be managed?
  • What happens if it goes wrong?
  • Who would provide the best rational for the dissenting opinion?

Posted in Change Management, Communication, Culture of Action, Process Improvement Tagged: Communication, Focus, Management Plan, People Process Technology, Performance Management, PM Venn Diagram, Process Improvement, Vision

Share This Article
Facebook Pinterest LinkedIn
Share

Follow us on Facebook

Latest News

8 MCP Tools for Market and Consumer Intelligence Workflows -- AI-generated illustration
8 MCP Tools for Market and Consumer Intelligence Workflows
Artificial Intelligence Exclusive
How Local Service Businesses Can Map Which Neighborhoods Generate the Most Revenue -- AI-generated illustration
How Local Service Businesses Can Map Which Neighborhoods Generate the Most Revenue
Business Intelligence
Best VMware Alternatives in Thailand for Private Cloud and HCI Deployments -- AI-generated illustration
Best VMware Alternatives in Thailand for Private Cloud and HCI Deployments
Cloud Computing Exclusive IT
Using Safety Metrics and Incident Data to Reduce Construction Risk and Insurance Costs -- AI-generated illustration
Using Safety Metrics and Incident Data to Reduce Construction Risk and Insurance Costs
Big Data Exclusive

Stay Connected

1.2KFollowersLike
33.7KFollowersFollow
222FollowersPin

You Might also Like

Diabolocom Provides Customer Interaction in the Cloud Solution
Uncategorized

Diabolocom Provides Customer Interaction in the Cloud Solution

0 Min Read
Marketers Using Social Media: Do they Get it or are they Panicking?
Uncategorized

Marketers Using Social Media: Do they Get it or are they Panicking?

5 Min Read
Accurate Sales Forecasting: 4 Secrets
Uncategorized

Accurate Sales Forecasting: 4 Secrets

5 Min Read
My approach to Management
Uncategorized

My approach to Management

12 Min Read

SmartData Collective is one of the largest & trusted community covering technical content about Big Data, BI, Cloud, Analytics, Artificial Intelligence, IoT & more.

Chatbots and SEO: How Can Chatbots Improve Your SEO Ranking?
Artificial Intelligence Chatbots Exclusive
The Art of Conversation: Enhancing Chatbots with Advanced AI Prompts
Chatbots

Quick Link

  • About
  • Contact
  • Privacy
Follow US
© 2008-26 SmartData Collective. All Rights Reserved.
Welcome Back!

Sign in to your account

Username or Email Address
Password

Lost your password?