Machine learning is about automatically finding patterns in data. In trading systems we are interested in finding all the patterns and then choosing the ones that usually precede price increases (or anything else you can find a way to profit from).
Innovation in the field comes from developing new pattern identification algorithms. Typically, these algorithms function similarly so you can compare the pros and cons of each and create a modular system in which you can swap them out. Each algorithm makes certain assumptions that influence the applications they are appropriate for. Financial market data is highly noisy, non-stationary, and even the noise is heterogeneous. This is different than, say, medical diagnostic data, where the goal is to automatically diagnose a patient based on their symptoms and health history.
In the past, I looked at neural networks and support vector machines. These are the algorithms that seemed applicable to trading. A few others which seem less powerful: linear regression, naïve bayes, and nearest neighbors. (Sadly, most big institutional factor models are based on linear regression.)
Now take a step back. Consider how a stock screener works…
Machine learning is about automatically finding patterns in data. In trading systems we are interested in finding all the patterns and then choosing the ones that usually precede price increases (or anything else you can find a way to profit from).
Innovation in the field comes from developing new pattern identification algorithms. Typically, these algorithms function similarly so you can compare the pros and cons of each and create a modular system in which you can swap them out. Each algorithm makes certain assumptions that influence the applications they are appropriate for. Financial market data is highly noisy, non-stationary, and even the noise is heterogeneous. This is different than, say, medical diagnostic data, where the goal is to automatically diagnose a patient based on their symptoms and health history.
In the past, I looked at neural networks and support vector machines. These are the algorithms that seemed applicable to trading. A few others which seem less powerful: linear regression, naïve bayes, and nearest neighbors. (Sadly, most big institutional factor models are based on linear regression.)
Now take a step back. Consider how a stock screener works. First you say, “keep a stock if its P/E is under 15.” Then you add another condition: “Only keep those with debt/equity less than 1.0.” Then you might add one more filter: “Of those, only keep the stocks with market cap under $500 million.” Every ticker is passed through this list of conditions and some are rejected at each step. You hope the remaining stocks are good values and will outperform the market. The problem is that you don’t really know when you make a screen by hand. Factor model software, used by many institutional investors, will automatically determine how useful a certain criteria is by using simple linear regression and backtesting.
What’s the problem with linear regression? This is a linear relationship: y=mx+b. It’s great for modeling something like, how much will a company’s taxes increase if the profit goes up by $100? m will equal the tax rate, .35. But a linear relationship can’t precisely model all sorts of things we regularly see. Let’s say you want to model Facebook and other social networks’ profitability based on the number of hits their sites get each day. There is a well-documented network effect where going from the second most popular to first is much more significant than going from fifth to fourth. A linear model could only capture part of this effect. Another situation would be estimating someone’s weight by looking at how tall they are. Weight is roughly proportional to volume which grows as the cube of height, so linear regression would fail here, too.
Now I’ll explain the decision tree algorithm. I’ll build on these two thought experiments and compare it to support vector machines and neural nets.
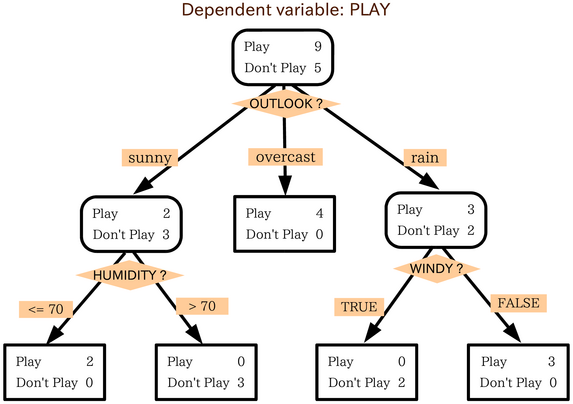
A decision tree is just like the screening example, but more sophisticated. The screener is not a tree in the sense that it has only two outcomes: keep or reject. The decision tree keeps analyzing the “rejected” ones. So instead of saying, “throw away the ones with P/E over 15”, the decision tree would then analyze those further, possibly adding in some typical growth criteria, like “keep those with analysts’ earnings estimates of at least 20%”. But intuitively you should think of it as a sophisticated automatic screener. Wikipedia has a good little example; the graphic below is copied from there to make the note more interesting.
You might wonder how it can work automatically. It’s a product of how incredibly fast computers are. Let’s say you have three variables, P/E, debt/equity, and market cap.
1) The algorithm randomly selects 1, say P/E.
2) The algorithm loops through many values for the P/E, say {1,2,3,4,5,6,7,8,9,10,…,30,31,…,max}, where max = the maximum P/E of all stocks being considered, and determines the P/E number that best splits the data into out-performers and under-performers. (Other “loss functions” are also common) This is very computationally demanding.
3) Then the algorithm repeats (recursively) on each of the subsets determined by the P/E split. It may divide them again by P/E or maybe by debt/equity or market cap.
4) Once the tree has many branches and the data is reasonably well classified (this is an important parameter which I won’t go into depth about here), you’re done training and you can start using it for actual prediction on new data.
Here’s the simplest example of how a decision tree can introduce nonlinearity: First it says companies with a P/E <> 3 are good. So now on a number line of P/Es, it goes bad-good-bad. It turns out that linear models cannot learn this relationship, and support vector machines can, with some care by the programmer. (Our analysis can be justified by imagining that P/E < 15=”” means=”” good=”” value,=”” but=”” p/e=””>< 3=”” means=”” screwy=”” accounting=”” and=”” bad=”” data,=”” so=”” you=”” eliminate=””>
Trees have other nice properties including they handle missing data and outliers well, they can mix categorical and numeric inputs, and the trained learner is easier to interpret.
In another note soon, I’ll explain why I decided to build a system based on a further enhancement of this decision tree concept: the “random forest” or tree bagging. Obviously decision trees already have advantages, but I’ll go into the weaknesses and further improvements and explain how I built and backtested the system.