We use cookies, including third-party cookies from Google to serve personalized ads through AdSense, to operate this site and understand how it is used. By continuing to browse, you accept this use. See our Privacy Policy and Terms of Use for details, including how to opt out of personalized advertising.
Accept
SmartData CollectiveSmartData Collective
  • Analytics
    AnalyticsShow More
    chatgpt image jul 21, 2026, 04 34 30 pm
    4 Core Benefits of Predictive Maintenance after Vibration Analysis
    10 Min Read
    How Does Data Mining Boost Customer Satisfaction in Logistics? Harnessing Analytics for Results -- AI-generated illustration
    How Does Data Mining Boost Customer Satisfaction in Logistics? Harnessing Analytics for Results
    11 Min Read
    chatgpt image jul 13, 2026, 04 23 45 pm
    How Data Analytics Helps Companies Improve User Engagement
    19 Min Read
    chatgpt image jul 13, 2026, 03 59 46 pm
    How Data Analytics Improves Multi-Location Search Strategies
    10 Min Read
    cybersecurity efforts
    How Behavioral Analytics and AI Are Redefining Cybersecurity for Boca Raton Businesses
    14 Min Read
  • Big Data
  • BI
  • Exclusive
  • IT
  • Marketing
  • Software
Search
© 2008-25 SmartData Collective. All Rights Reserved.
Reading: Market Analysis Tips: Death by Survey
Share
Notification
Font ResizerAa
SmartData CollectiveSmartData Collective
Font ResizerAa
Search
  • About
  • Help
  • Privacy
Follow US
© 2008-23 SmartData Collective. All Rights Reserved.
SmartData Collective > Uncategorized > Market Analysis Tips: Death by Survey
Uncategorized

Market Analysis Tips: Death by Survey

michgoetz
michgoetz
6 Min Read
Market Analysis Tips:  Death by Survey
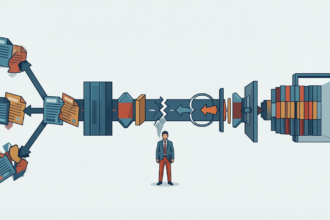
Illustration generated with Qwen Image.
SHARE

I’m naturally inquisitive. It is probably the single greatest quality for my career choice. So, when I can get in front of customers and get them to talk about their likes, dislikes, challenges, and successes, I’m in heaven. But, enough about me…

And, that’s the point. Market research is about the customer and the market, not your company and your product. I’ve been conducting some research on how businesses are implementing surveys and inviting customers to participate in market research. What I’m finding is a disconnect between the need for information and a respect for the time and experiences of participants. This is most apparent in quantitative research pointing to a need to address our research methodologies and design.

Step 1: Prepare a mock presentation as a guide for information needed
You should know what you need to show rather than have the question guide you. This isn’t The Matrix. Your are not Neo. In this instance, it is not the question that guides you (Reference: It’s the Question That Guides Us for when this is true). It is the decision. Take the time to create visual mock ups of charts you will need to make a decision. Map your questions to complete the charts.

Step 2: Ask the question once
There is nothing more frustrating for a participant than to be asked the same question 5 different ways. This was particularly true when I participated in studies that were attempting to determine pricing, packaging, and brand influences. These were typically conjoint analysis. I spent 20 minutes moving through questions that many times I felt I already answered. Consider if a conjoint analysis is truly necessary for what you need to know. Or, consider the number of things you want to test to improve the number of iterations you need to understand intent.

More Read

Platform distribution risks
Which BI Analytics Tool Does My Company Need?
Family Sets Up Cloud Controlled Christmas Lights for the World to Enjoy
Efficient DAM Systems for Revitalizing the Content Marketing Platform
IoT Field Notes: The Seed Fund

Step 3: Design questions that a participant understands and can answer
As industry experts we have a strong perspective of how people purchase, what motivates them, and who they are. However, we are trying to determine just this when we design our research. One survey tried to get at what kept me from purchasing particular products. Instead of obvious statements like price, quality, or availability, I had to read statements that defined how I felt. I could relate to none of these statements. My answers reflected this.

Step 4: Be prepared to compensate participants and be mindful of their time
List providers and survey panels are taking steps to ensure that surveys are not filled by professional survey takers. However, the way panelists are compensated, they have to participate in everything they can to get a reward. There are no real safeguards to ensure that you get people are really the ones you want. Participants will cover the truth to get more points, sweepstakes entries, or $5 gift certificates. Customers want to provide feedback on items they use and topics they care about. Reward them for participating. Then, be prepared to not survey them for a time. You can then focus more on quality participants and weed out those that are of little value to the study. Create win-win situations.

In the end, a customer needs to know, “What’s in it for me?” One of the best areas we can turn to for a perspective on this is a customer advisory board or beta testing group. Everyone that participates has a stake in getting the right answer. The customer knows that by providing feedback they can get the service or product they want. The company values the customer insight and how they can perform or better serve customer in the market. Surveys have value. If you start with your needs first, you may not get the most from your effort. Done correctly they are insightful, directional, and cost effective.

Share This Article
Facebook Pinterest LinkedIn
Share

Follow us on Facebook

Latest News

Analyst points at colorful circular data dashboard on screen - information technology business metrics
How Fragmented Workplace Tech Undermines Reliable Business Metrics and Reporting
Cloud Computing Exclusive Infographic IT
Using Multi-Source Data and Analytics to Detect Operational Drift Across Franchise Networks -- AI-generated illustration
Using Multi-Source Data and Analytics to Detect Operational Drift Across Franchise Networks
Exclusive Infographic
Beyond The First Impression: The Long-Lasting Impact Of Sensory Marketing -- AI-generated illustration
Beyond The First Impression: The Long-Lasting Impact Of Sensory Marketing
Infographic Marketing
The Infrastructure Gap Slowing Data Center Growth -- AI-generated illustration
The Infrastructure Gap Slowing Data Center Growth
Big Data Cloud Computing Exclusive Infographic IT

Stay Connected

1.2KFollowersLike
33.7KFollowersFollow
222FollowersPin

You Might also Like

The Hadoop Honeymoon Is Over
Uncategorized

The Hadoop Honeymoon Is Over

8 Min Read
“Why taking a few punches on the financial crisis just might save IT” by Patrick Gray on TechRepublic
Uncategorized

“Why taking a few punches on the financial crisis just might save IT” by Patrick Gray on TechRepublic

4 Min Read
More Than Pretty Pictures: Visualizing Insight
Uncategorized

More Than Pretty Pictures: Visualizing Insight

4 Min Read
The Technology Adoption Life Cycle
Uncategorized

The Technology Adoption Life Cycle

6 Min Read

SmartData Collective is one of the largest & trusted community covering technical content about Big Data, BI, Cloud, Analytics, Artificial Intelligence, IoT & more.

ai chatbot
How AI Website Chatbots Improve Customer Support and Lead Generation
Chatbots Exclusive
Artificial Intelligence for eCommerce: A Closer Look
Artificial Intelligence

Quick Link

  • About
  • Contact
  • Privacy
Follow US
© 2008-26 SmartData Collective. All Rights Reserved.
Welcome Back!

Sign in to your account

Username or Email Address
Password

Lost your password?