Cookies help us display personalized product recommendations and ensure you have great shopping experience.

By using this site, you agree to the Privacy Policy and Terms of Use.
Accept
SmartData CollectiveSmartData Collective
  • Analytics
    AnalyticsShow More
    composable analytics
    How Composable Analytics Unlocks Modular Agility for Data Teams
    9 Min Read
    data mining to find the right poly bag makers
    Using Data Analytics to Choose the Best Poly Mailer Bags
    12 Min Read
    data analytics for pharmacy trends
    How Data Analytics Is Tracking Trends in the Pharmacy Industry
    5 Min Read
    car expense data analytics
    Data Analytics for Smarter Vehicle Expense Management
    10 Min Read
    image fx (60)
    Data Analytics Driving the Modern E-commerce Warehouse
    13 Min Read
  • Big Data
  • BI
  • Exclusive
  • IT
  • Marketing
  • Software
Search
© 2008-25 SmartData Collective. All Rights Reserved.
Reading: Quick Visualization of irs.gov Search Queries
Share
Notification
Font ResizerAa
SmartData CollectiveSmartData Collective
Font ResizerAa
Search
  • About
  • Help
  • Privacy
Follow US
© 2008-23 SmartData Collective. All Rights Reserved.
SmartData Collective > Big Data > Data Mining > Quick Visualization of irs.gov Search Queries
Data MiningData VisualizationPredictive Analytics

Quick Visualization of irs.gov Search Queries

Editor SDC
Editor SDC
3 Min Read
SHARE

Here is a quick visualization I did in honor of April 15th to investigate what people looking for on tax day…
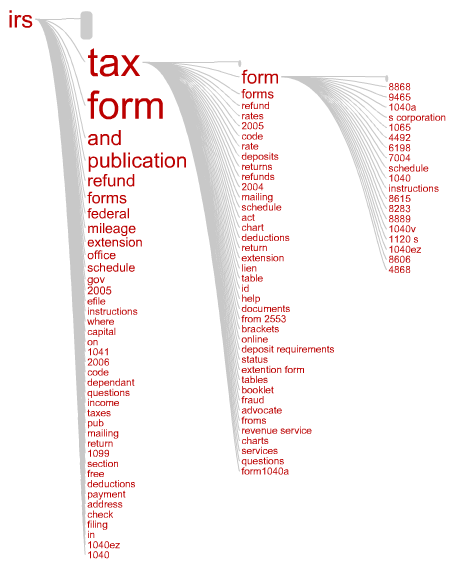
This “query tree” shows the most frequent searches starting with the term “irs”. Each branch in the tree represents a query where the words are sized according to frequency of occurrence. I like how you can see at a glance what the most popular tax forms are by following the “irs tax form …” branch.

It was created by uploading search queries from AOL users leading to clicks on irs.gov during Spring 2006 to Concentrate. This image is a snapshot of an interactive flash visualization, where the focus term was “irs”. Looking at query patterns like this can help you get an idea of what people are looking for and how to better organize your site so they can find it quickly.

More Read

“One of the things our grandchildren will find quaintest about us is that we distinguish the digital…”
Worst Practices in Data Mining
The Must-Have Skills You Need to Become a Data Scientist
Smart Data Collective Free Webinar
Careful with the S-word

The raw data is from the released AOL Search data sample, and consists of the subset of unique queries leading to clicks on irs.gov from March to May 2006. The IRS queries used to make the visualization can be downloaded here: irs.gov.queries.csv (191K)

Here are the top 10 queries in the file:

…

QuerySearches
irs4787
irs.gov2282

Here is a quick visualization I did in honor of April 15th to investigate what people looking for on tax day…

This “query tree” shows the most frequent searches starting with the term “irs”. Each branch in the tree represents a query where the words are sized according to frequency of occurrence. I like how you can see at a glance what the most popular tax forms are by following the “irs tax form …” branch.

It was created by uploading search queries from AOL users leading to clicks on irs.gov during Spring 2006 to Concentrate. This image is a snapshot of an interactive flash visualization, where the focus term was “irs”. Looking at query patterns like this can help you get an idea of what people are looking for and how to better organize your site so they can find it quickly.

The raw data is from the released AOL Search data sample, and consists of the subset of unique queries leading to clicks on irs.gov from March to May 2006. The IRS queries used to make the visualization can be downloaded here: irs.gov.queries.csv (191K)

Here are the top 10 queries in the file:

QuerySearches
irs4787
irs.gov2282
www.irs.gov1975
internal revenue service1154
irs forms608
tax forms361
irs tax forms196
internal revenue158
taxes142
wheres my refund139
federal tax forms125
irs refunds106

TAGGED:searchvisualization
Share This Article
Facebook Pinterest LinkedIn
Share

Follow us on Facebook

Latest News

student learning AI
Advanced Degrees Still Matter in an AI-Driven Job Market
Artificial Intelligence Exclusive
mobile device farm
How Mobile Device Farms Strengthen Big Data Workflows
Big Data Exclusive
composable analytics
How Composable Analytics Unlocks Modular Agility for Data Teams
Analytics Big Data Exclusive
fintech startups
Why Fintech Start-Ups Struggle To Secure The Funding They Need
Infographic News

Stay Connected

1.2kFollowersLike
33.7kFollowersFollow
222FollowersPin

You Might also Like

SIGIR ‘09 Registration Details

3 Min Read

Wolfman vs. Googzilla

2 Min Read

Google: Find Similar Images

3 Min Read

Did Web Search Kill Artificial Intelligence?

2 Min Read

SmartData Collective is one of the largest & trusted community covering technical content about Big Data, BI, Cloud, Analytics, Artificial Intelligence, IoT & more.

ai is improving the safety of cars
From Bolts to Bots: How AI Is Fortifying the Automotive Industry
Artificial Intelligence
AI and chatbots
Chatbots and SEO: How Can Chatbots Improve Your SEO Ranking?
Artificial Intelligence Chatbots Exclusive

Quick Link

  • About
  • Contact
  • Privacy
Follow US
© 2008-25 SmartData Collective. All Rights Reserved.
Go to mobile version
Welcome Back!

Sign in to your account

Username or Email Address
Password

Lost your password?