In my continued quest to build an operational model that properly accounts for the costs of different cloud web services, I have reached back to the visual vocabulary of operational analysis. If it was good enough to build BMC Software I figured it would be good enough for this task.
The following figure captures the typical resources in a modern data center. In the vocabulary of operational analysis we have servers and transactions, and the diagram depicts the read and write transactions going into different services such as filers or Internet, and read responses coming out. If you would build your own data center these servers and services would reflect all your capital and operational expenditures.
Different data centers select different resources to monetize. This makes the comparison between different providers so difficult: they are all selling something different.
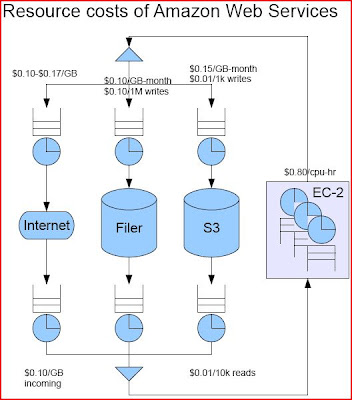
Let’s start with Amazon as the baseline since AWS tries to monetize all the resources in its data center, except for the internal routers. The next diagram shows the resource costs that Amazon charges you when running an application on their data centers.
Now compare that with a second provider, GoGrid. GoGrid does n…
In my continued quest to build an operational model that properly accounts for the costs of different cloud web services, I have reached back to the visual vocabulary of operational analysis. If it was good enough to build BMC Software I figured it would be good enough for this task.
The following figure captures the typical resources in a modern data center. In the vocabulary of operational analysis we have servers and transactions, and the diagram depicts the read and write transactions going into different services such as filers or Internet, and read responses coming out. If you would build your own data center these servers and services would reflect all your capital and operational expenditures.
Different data centers select different resources to monetize. This makes the comparison between different providers so difficult: they are all selling something different.
Let’s start with Amazon as the baseline since AWS tries to monetize all the resources in its data center, except for the internal routers. The next diagram shows the resource costs that Amazon charges you when running an application on their data centers.
Now compare that with a second provider, GoGrid. GoGrid does not monetize the incoming internet connection into their data center. So if you have a workload that reads a lot of data from the internet, GoGrid is fantastic. Also, GoGrid does not use a filer in their architecture, instead giving the server its own local disk instance that is managed and maintained. This works very well for web applications but does not work well for running a distributed file system instance. So running Hadoop on GoGrid is not attractive. The following diagram depicts GoGrid’s monetization strategy.
When you compare both diagrams it is clear that GoGrid is the better solution for running a web application server. On top of that, GoGrid offers free load balancers, which you would need to pay for separately on Amazon.
This visual vocabulary presented here makes it very easy to identify what types of workloads would fit on different cloud providers. It also shows you the high-cost items in the overall IT infrastructure you need to outsource your application.
To make the accounting complete, we also need a model of our workload that quantifies the storage, compute, and I/O requirements. For web application services the world of cloud solutions is well represented, but for utility computing this is not the case. The cost of filer and storage are significant and quickly become the overriding cost components for a workload. Furthermore, given the fact that storage costs accumulate even when you are not computing makes the on-demand argument less genuine. Finally, the use of cpu instance hours is not good enough for utility computing. Using the electric grid as comparison, I am consuming electrons, and pay accordingly. In proper utility computing I am consuming instructions and I/Os. These metrics are independent of the speed of the processors or filer on which I run and thus I do not need to guess what type of cpu-instance-hours I would consume. By providing instruction and I/O consumables providers can differentiate on the basis of capacity or latency in the same way that electricity providers do. Without that compensation model, utility computing is a ways off IMHO.
Link to original post


