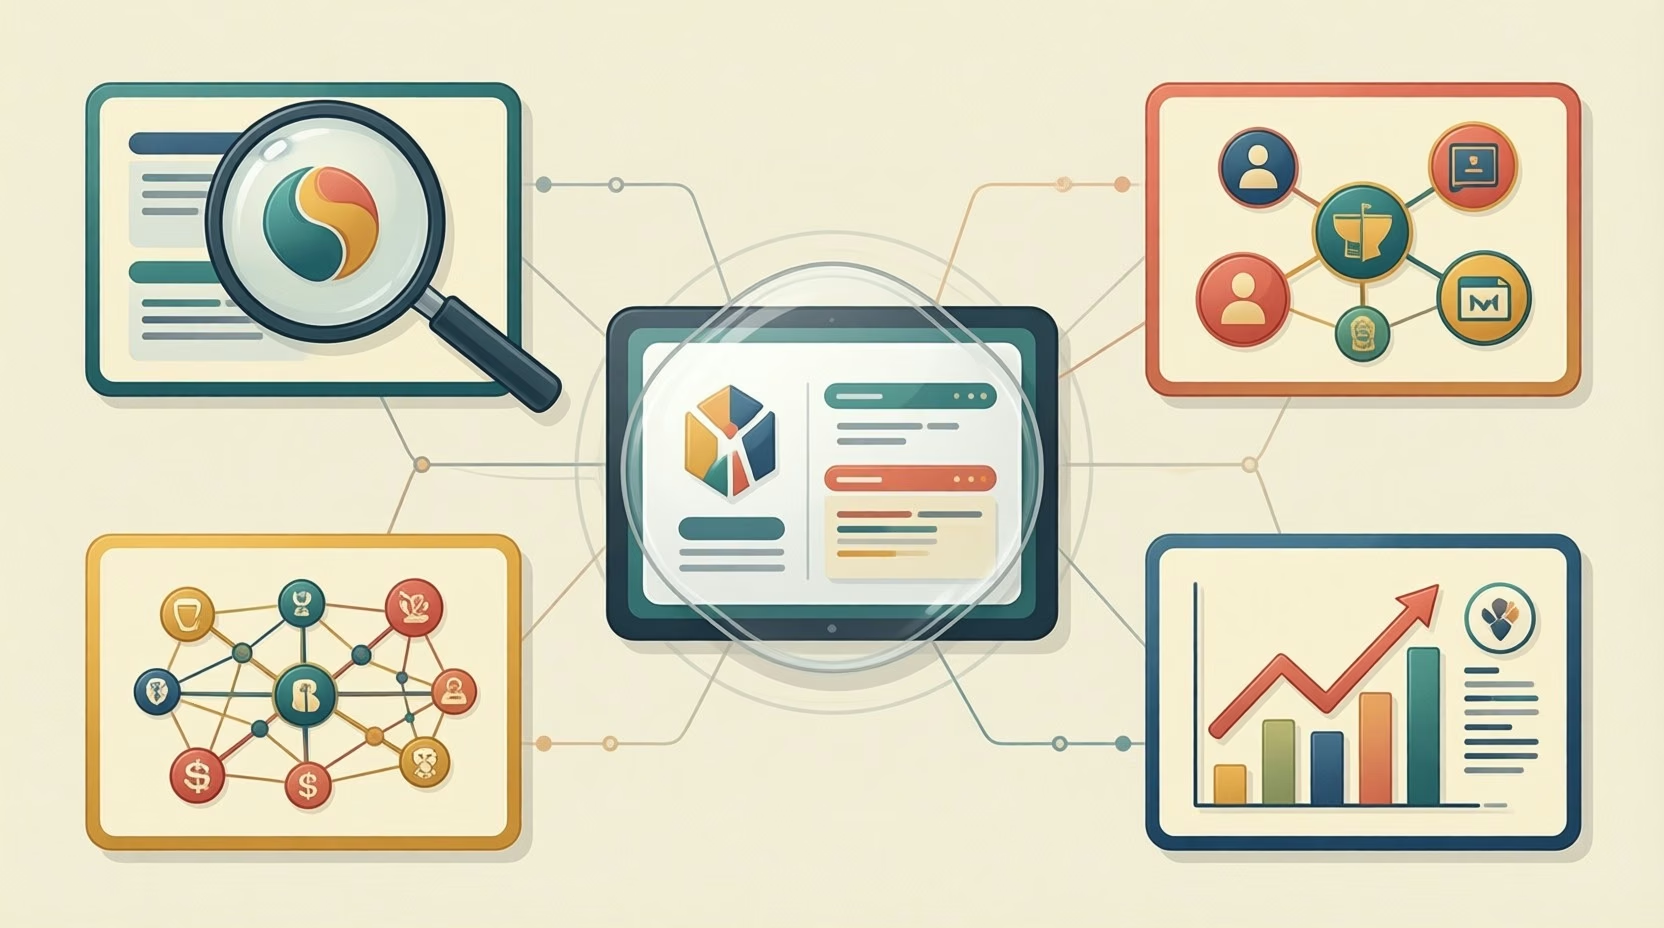
Modern organizations know that they need more than visualization. Modern visualization should enable users to collect accurate, coherent, related and relevant data all within an effective visual frame.
VisionWaves is a software provider that has developed tools of this sort aiming to help users visualize and understand what is happening and how it relates to important business areas, thereby achieving a comprehensive view of their business. Beyond monitoring their organization from a data perspective, VisionWaves’ complete business cockpit enables users to connect the dots between data, processes, and people.
Data, Process, and Intelligence
Some organizations have managed to gain effective control over their data flow, obtain important insights through dashboards and/or reports, and discern relevant data to making informed decisions. However, despite having eliminated many data silos by concentrating data within a single repository (e.g., a data warehouse, data mart, or similar model), for many organizations information continues to disperse, adjusting to the different needs within the organization (by line of business, department, or functional area). So, while the existing BI structure provides insights that are enormously relevant, what’s required for a complete picture of the organization is a consolidation of the information—not just the data.
As business pressures increase, the need for information and the speed of business can sometimes get out of control. The need for information never wavers—its value remains—but the need for collaboration, process control, and performance monitoring is augmented. When decisions need to be made fast, monitoring needs to be effective.
From a business point of view, for some core activities such as planning, risk management, and many others, having complete visualization and collaboration is vital for interpreting, analyzing, and acting upon information. More than ever, organizations need to close the gap between data and process management, and find a way to monitor and visualize both in a single, cohesive view.
The Business Cockpit
VisionWaves, a software company founded in 2000 in the Netherlands, has developed a product that can give organizations a wider scope for visualizing the state of an organization, at the same time enabling a direct correlation between business process and business data. The reach of collaboration is expanded between all management areas of an organization.
The VisionWaves initiative consists of creating a “management cockpit”—a visualization tool that generates the necessary data relations between business and process data, to consolidate that data within a single visual point.
The management cockpit unifies all the necessary information regarding a manager’s area of responsibility within a single framework, including everything from reports and documentation to key performance indicators and process analysis capabilities for measuring performance and root-cause effects more effectively (see figure below). VisionWaves differentiates itself with its ability to visually analyze risk and compliance, as well as to use model-driven predictive analysis and mining to generate what-if scenarios and planning tasks.

VisionWaves screen-cap, courtesy of VisionWaves
The menu at the top of the application’s main screen gives the user with more views: risk and compliance (GRC), workflow, strategy, key results, etc. These views are configurable to suit the user’s priorities. Without leaving the cockpit it’s possible to access different menu items for different visualizations, for different purposes—the cockpit becomes the control center for a collection of pages.
With regard to pre-existing third-party analytics and business process management (BPM) applications, VisionWaves is non-invasive, and avoids the custom development sometimes required with complex integrations. It takes an open data and service-oriented architecture approach, has the ability to connect to them by having a multilayered, service-oriented, and metadata-driven model which enables wide integration with multiple third-party systems.
The VisionWaves Model
VisionWaves describes the value of its management cockpit through the following aspects:
- Synergy—for having an end-to-end overview of an organization’s value chain
- Collaboration—for enabling enterprise alignment and communication across the organization
- Efficiency—by integrating seamlessly intelligence and operations, and then streamlining the managerial process and decision making
- Improvement—for being able to perform changes and adjustments in an agile way and in a short time frame, and being able to change analysis models accordingly, quickly
With strong experience in industries such as aviation and defense as well as banking and insurance, VisionWaves’ approach seems to be an efficient way for achieving efficient consolidation of information and practices (a.k.a. governance) from a management perspective.
Modern organizations understand the importance of achieving efficiency at all levels. One way to encourage efficiency is to streamline communication, monitor processes, and improve data analysis. Closing the gap between data and process execution is key to achieving efficiency. VisionWaves’ proposal is refreshing and elegant, and at the same time effective—a business application worth keeping an eye on.
Original Article