
We use cookies, including third-party cookies from Google to serve personalized ads through AdSense, to operate this site and understand how it is used. By continuing to browse, you accept this use. See our Privacy Policy and Terms of Use for details, including how to opt out of personalized advertising.
Accept
SmartData CollectiveSmartData Collective
  • Analytics
    AnalyticsShow More
    chatgpt image jul 21, 2026, 04 34 30 pm
    4 Core Benefits of Predictive Maintenance after Vibration Analysis
    10 Min Read
    How Does Data Mining Boost Customer Satisfaction in Logistics? Harnessing Analytics for Results -- AI-generated illustration
    How Does Data Mining Boost Customer Satisfaction in Logistics? Harnessing Analytics for Results
    11 Min Read
    chatgpt image jul 13, 2026, 04 23 45 pm
    How Data Analytics Helps Companies Improve User Engagement
    19 Min Read
    chatgpt image jul 13, 2026, 03 59 46 pm
    How Data Analytics Improves Multi-Location Search Strategies
    10 Min Read
    cybersecurity efforts
    How Behavioral Analytics and AI Are Redefining Cybersecurity for Boca Raton Businesses
    14 Min Read
  • Big Data
  • BI
  • Exclusive
  • IT
  • Marketing
  • Software
Search
© 2008-25 SmartData Collective. All Rights Reserved.
Reading: The Vast Majority of Analytics is Still Reporting (And That’s Not So Bad)
Share
Notification
Font ResizerAa
SmartData CollectiveSmartData Collective
Font ResizerAa
Search
  • About
  • Help
  • Privacy
Follow US
© 2008-23 SmartData Collective. All Rights Reserved.
SmartData Collective > Analytics > The Vast Majority of Analytics is Still Reporting (And That’s Not So Bad)
Analytics

The Vast Majority of Analytics is Still Reporting (And That’s Not So Bad)

Timo Elliott
Timo Elliott
4 Min Read
The Vast Majority of Analytics is Still Reporting (And That’s Not So Bad)
Photo by Pexels on Pixabay (https://pixabay.com/photos/blur-chart-computer-data-finance-1853262/)
SHARE

Despite the surge in interest and sales of modern data discovery tools like SAP BusinessObjects Lumira and SAP BusinessObjects Cloud, corporations are still really, really interested in reporting.

At the recent Gartner Data & Analytics event in Texas, Cindi Howson showed that descriptive analytics remains by far the most common type of analysis that companies do in the real world.
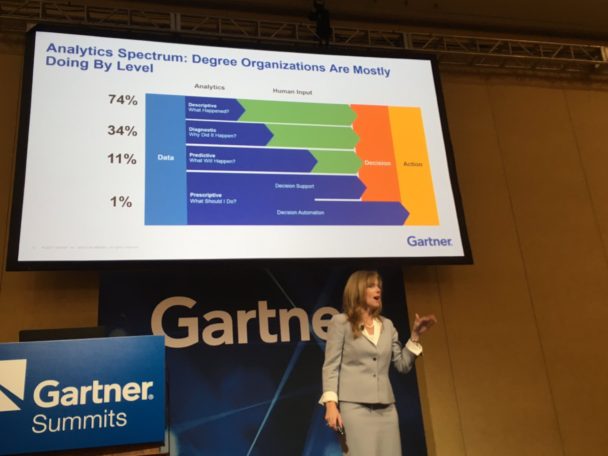
Last year, Gartner redefined the BI and Analytics Platforms Magic Quadrant, relegating traditional self-service and interactive reporting tools that do the bulk of today’s descriptive analytics, like WebIntelligence, to a separate Enterprise-Reporting Based Platforms report — even though the newer tools made up only 25% of the overall market for analytics software.

Demand for the new tools is increasing rapidly, for good reasons. In particular, they are more agile and so can more easily keep up with ever-changing analytic needs. But in most organizations, there are still plenty of business benefits that can be achieved with traditional enterprise reporting tools.

More Read

Looking at Trees to Understand the Forest
Students at the MIT Media Lab have developed a wearable…
Can Big Data and Hadoop Feed the World?
Webinar on the ROI of business rules in decision management
Connection Cloud: Realizing Value from Proliferating Siloed Data Stores and BI

For example, fresh-food supplier Pret a Manger used WebIntelligence to deliver real-time, actionable information on mobile devices to front-line workers.

The insights made a huge difference to the way the company was run, even though this investment is no longer considered “analytics” according to Gartner’s latest criteria.

As Donald MacCormick has often pointed out in his blog posts, the reality is that many (most?) people just want easy access to the information they need to do their job.

For example, some of the most powerful computers in the world are used to calculate weather predictions, but most of us are happy to consume all that complexity as a simple symbol that tells us whether to bring an umbrella or not.

Even if newer solutions can provide the same information in more flexible ways, many organizations have made big investments in traditional interactive reporting and IT-created dashboards over the years and see no big incentive to recreate them all from scratch in newer tools.

This helps explain the remarkable robustness of the market share held by traditional analytics vendors. For example, I stumbled across this old chart of IDC market share data (3D charts alert!). It shows the market-leading share of SAP BusinessObjects in 1997.

Analytics has been at or near the top of CIO priority lists ever since. Every year, organizations carefully compare the dozens of different analytics products available to them, and invest in the ones that are the best fit for their real-world needs.

IDC eventually renamed the category “Worldwide Query, Reporting, and Analysis” revenue, but SAP / BusinessObjects has now been the number one analytics vendor for over two decades.

For organizations that already have a lot of reports, it makes a lot of sense to continue to invest in vendors that can support their existing infrastructure as well as help them with the transition to compatible modern data discovery and visualization tools.

At next week’s Gartner Data & Analytics event, I’m sure we’ll hear a lot more about the future of BI — but in the meantime, it’s clear that the reporting past is far from dead.

Share This Article
Facebook Pinterest LinkedIn
Share

Follow us on Facebook

Latest News

What Your Brand Misses That Data Reveals -- AI-generated illustration
What Your Brand Misses That Data Reveals
Big Data Exclusive Infographic
5 Common Mistakes Businesses Make During the Risk Assessment Process -- AI-generated illustration
5 Common Mistakes Businesses Make During the Risk Assessment Process
Business Intelligence Exclusive Risk Management
Best Age Estimation Software in 2026: Which Facial Age Providers Actually Hold Up -- AI-generated illustration
Best Age Estimation Software in 2026: Which Facial Age Providers Actually Hold Up
Artificial Intelligence Exclusive Machine Learning
Top 8 Multi-Cloud Architecture Tools for Automated Infrastructure Design in 2026 -- AI-generated illustration
Top 8 Multi-Cloud Architecture Tools for Automated Infrastructure Design in 2026
Cloud Computing Exclusive IT

Stay Connected

1.2KFollowersLike
33.7KFollowersFollow
222FollowersPin

You Might also Like

Open Ocean

1 Min Read
Moneyball, a Must-watch Movie for the Business Analytics Savvy
Analytics

Moneyball, a Must-watch Movie for the Business Analytics Savvy

8 Min Read

What Makes a Data Mining Skeptic?

1 Min Read

When “Little Data” Can Do the Trick

5 Min Read

SmartData Collective is one of the largest & trusted community covering technical content about Big Data, BI, Cloud, Analytics, Artificial Intelligence, IoT & more.

data-driven web design
5 Great Tips for Using Data Analytics for Website UX
Big Data
AI chatbots
AI Chatbots Can Help Retailers Convert Live Broadcast Viewers into Sales!
Chatbots

Quick Link

  • About
  • Contact
  • Privacy
Follow US
© 2008-26 SmartData Collective. All Rights Reserved.
Welcome Back!

Sign in to your account

Username or Email Address
Password

Lost your password?