
Currently R, SAS and Python are the three languages ruling the analytics industry. Expertise in at least one of the three language is a must to build a competitive profile. But mastering only one language might not make you a hot selling property.
Currently R, SAS and Python are the three languages ruling the analytics industry. Expertise in at least one of the three language is a must to build a competitive profile. But mastering only one language might not make you a hot selling property. Even if you are not an expert in each of the three languages, you need to know what is the arena of strength for the three languages. In some of our previous articles, we covered interview questions in R (here)and SAS ( here).
We also covered the ways to train your brain for analytical thinking (here) and framework to develop structured thinking (here). In this article, we have collected few questions to estimate your expertise level in the three languages. The scores and results will just be directional and not a comprehensive view of your skill set.
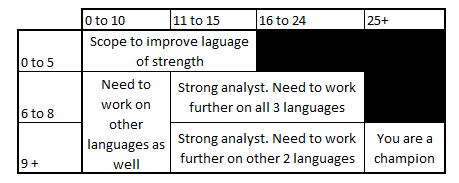
This test contains 5 questions each from the three languages. Each question carries 2 marks for being correct and no negative markings. You will need to calculate the total score in three sections and the score in the section you scored most. Following is the table you can refer to interpret the scores:

Guidelines
Here are a few guidelines you need to follow (to make your score more insightful):
1. You cannot use any knowledge other than yours to attempt the questions
2. You cannot use a calculator
3. The maximum time you can spend on each section cannot be more than 5 minutes.
4. The questions should be answered in an order.
5. You should not attempt questions which you are not 100% sure.
Test
Section 1 : SAS
Question 1) The following program is submitted.
data WORK.TEST;
input Name $ Age;
datalines;
John +35 ;
run;
Which values are stored in the output data set?
Name Age --------------------- John 35
Name Age --------------------- John (missing value)
Name Age --------------------- (missing value) (missing value)
- The DATA step fails execution due to data errors.
Question 2) You have two datasets with many to one mapping. You are trying to merge the two datasets using a Data-Merge statement (after sorting on the key). What will be the output :
A. Data error
B. Wrongly merged table
C.Merging happens fine and you get the rightly merged table
Question 3) Dataset A has 3 rows with all ids as “1″ and 2 rows with “2″. Dataset B has 2 rows with all ids as “1″ and 3 rows with “2″ . If you merge the two tables, the resultant table will have how many rows?
A. 4
B. 5
C. 6
D. 3
Question 4) The following SAS program is submitted:
data WORK.LOOP; X = 0; do Index = 1 to 5 by 2; X = Index; end; run; Upon completion of execution, what are the values of the variables X and Index in the SAS data set named WORK.LOOP?
- X = 3, Index = 5
- X = 5, Index = 5
- X = 5, Index = 6
- X = 5, Index = 7
Question 5) The following SAS program is submitted:
data WORK.TEMP; Char1='0123456789'; Char2=substr(Char1,3,4); run; What is the value of Char2?
- 23
- 34
- 345
- 2345
Section 2 : Python
Question 1 ) What is the difference between: import sklearn & from sklearn import datasets
a. the second statement does not work
b. Both are similar
c. First imports the entire module while the second only imports specific parts (datasets in this case) of the module and hence is more efficient
d. First statement imports modules while second imports function
e. None of the above
Question 2 ) How do you find median for a column (‘Age’) in dataframe (df) using Pandas
a. df.describe()
b. df.Age.median()
c. df[‘age’].median()
d. df[‘Age’].median()
e. median (df[‘Age’])
Question 3 ) Which of the following is not a valid data structure in Python?
a. List
b. Dictionary
c. Sets
d. Cubes
Question 4) Which of the following library – usage combination is wrong?
a. Pandas – Analysis & Handling of structured data
b. NLTK – Text Mining
c. urllib – Open a URL through your code
d. matplotlib – for creating libraries of plots
Question 5) Which of the following are valid for string representations:
a. ‘ ‘
b. “ “
c. ‘’’ ‘’’
d. All of the above
Section 3: R
Question 1) Which of the following statistical techniques cannot be implemented on R?
A. Logistic Regression
B. CART
C. CHAID
D. Linear Regression
E. All above can be implemented on R
Question 2) What is the value of f(6) using the following code?
> y <- 3> f <- function(x) {+ y <- 2+ y ^ 2 + g(x)+ }> g <- function(x) {+ x * y+ } Question 3) What is the value of the vector d, which is defined as follows :
> a <- c(2,3,4) > b <- c(1,2)
> d <- a*b
Question 4) Library “TM” is used for?
A. Time Management
B. Time Series modeling
C. Text Mining
D. CarT Modelling
Question 5) What is the difference between the commands “install.packages” and “library”?
A. Both do the same job
B. install.packages brings file to your system and library function loads the package to current session
C.Library function brings file to your system and install.packages function loads the package to current session
D. Execution of install.packages is done only when the session starts but function “library” is executed for running sessions.
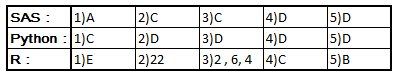
Answers

End Notes
The scores will guide you directionally as to which language you need to work on. Along with the knowledge of these languages, you also need to master other skills required to solve unstructured business problems (covered in this article). To survive in this industry you need to master at least one of these languages. To be an analytics star you need to excel in one language and know basic of the other two languages. To be an analytics champion you need to master all three languages. Note that only mastering data handling language might not make you successful analyst. Also, the three languages are not substitutes for each other, but complement each other to do various analysis.You can add more questions to this bank in the comment box below. For any clarifications on the question set, you can again comment below.
What was your score in this test? What do you think about interpreting these results from the table given in the article? Do you think it ties up well to your understanding?


