Cookies help us display personalized product recommendations and ensure you have great shopping experience.

By using this site, you agree to the Privacy Policy and Terms of Use.
Accept
SmartData CollectiveSmartData Collective
  • Analytics
    AnalyticsShow More
    image fx (67)
    Improving LinkedIn Ad Strategies with Data Analytics
    9 Min Read
    big data and remote work
    Data Helps Speech-Language Pathologists Deliver Better Results
    6 Min Read
    data driven insights
    How Data-Driven Insights Are Addressing Gaps in Patient Communication and Equity
    8 Min Read
    pexels pavel danilyuk 8112119
    Data Analytics Is Revolutionizing Medical Credentialing
    8 Min Read
    data and seo
    Maximize SEO Success with Powerful Data Analytics Insights
    8 Min Read
  • Big Data
  • BI
  • Exclusive
  • IT
  • Marketing
  • Software
Search
© 2008-25 SmartData Collective. All Rights Reserved.
Reading: Data Mining Models: Behavioral Segmentation and Classification
Share
Notification
Font ResizerAa
SmartData CollectiveSmartData Collective
Font ResizerAa
Search
  • About
  • Help
  • Privacy
Follow US
© 2008-23 SmartData Collective. All Rights Reserved.
SmartData Collective > Big Data > Data Mining > Data Mining Models: Behavioral Segmentation and Classification
Data MiningModeling

Data Mining Models: Behavioral Segmentation and Classification

Editor SDC
Editor SDC
4 Min Read
SHARE
Two of the most common applications of data mining models are for behavioral segmentation and classification. In behavioral segmentation, clustering models are used to analyze the behavioral patterns of the customers and identify actionable groupings with differentiated characteristics. Classification models are applied to predict the occurrence of an event (such as churn, purchase of an add-on product etc.) and estimate the event’s propensity.
Two of the most common applications of data mining models are for behavioral segmentation and classification. In behavioral segmentation, clustering models are used to analyze the behavioral patterns of the customers and identify actionable groupings with differentiated characteristics. Classification models are applied to predict the occurrence of an event (such as churn, purchase of an add-on product etc.) and estimate the event’s propensity. Classification (or propensity) models are typically used to optimize direct marketing campaigns for retaining (churn prevention) and expanding (cross / deep / up selling) the relationship with the customers.  
The appropriate data set-up for differs for each of the above applications as outlined below:
Behavioral segmentation models are based only on the most recent view of the customer and require a simple snapshot of this view, as shown in the next figure. However, since the objective is to identify a segmentation solution founded on consistent and not on random behavioral patterns, the included data should cover a sufficient time period of at least 6 months.

Classification models on the other hand, require the splitting of the modeling dataset in different time periods. To identify data patterns associated with the occurrence of an event, the model should analyze the customer profile before the event occurrence. Therefore, analysts should focus on a past moment and analyze the customer view before the purchase of an add-on product or before churning to a competitor.

Let’s consider for example a typical churn model. During the model training phase, the model dataset should be split to cover the following periods:

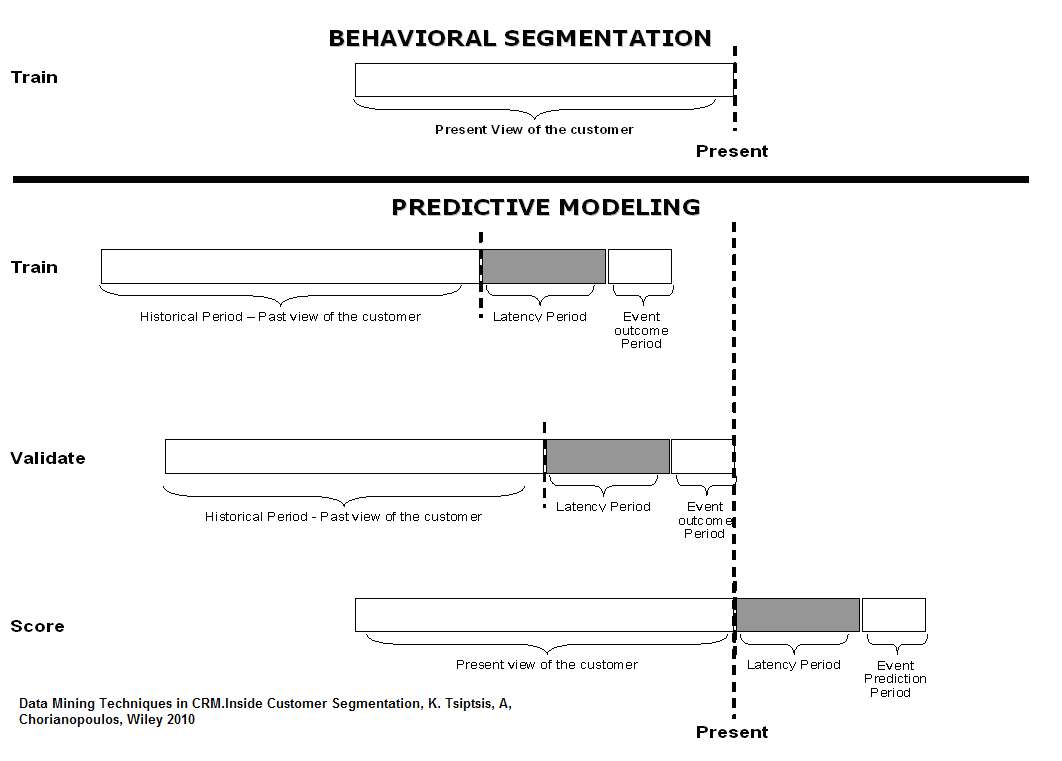
  1. Historical period: used for building the customer view in a past time period, before the occurrence of the event. It refers to the distant past and only predictors (input attributes) are used for building the customer view. 
  2. Latency period: It is reserved for taking into account the time needed to collect all necessary information to score new cases, predict future churners and execute the relevant campaigns.
  3. Event outcome period: used for recording the event outcome, for example churned within this period or not. It follows the historical and the latency period and it is used for defining the output field of the supervised model.

The model is trained by associating input data patterns of the Historical period with specific event outcomes recorded in the Event outcome period.

Typically, in the validation phase, the model’s predictive performance is evaluated in a disjoint dataset which covers different time periods. In the deployment phase new cases are scored according to their present view, specifically, according to the input data patterns observed in the period right before the present. The event outcome is unknown and its future value is predicted.

Share This Article
Facebook Pinterest LinkedIn
Share

Follow us on Facebook

Latest News

image fx (2)
Monitoring Data Without Turning into Big Brother
Big Data Exclusive
image fx (71)
The Power of AI for Personalization in Email
Artificial Intelligence Exclusive Marketing
image fx (67)
Improving LinkedIn Ad Strategies with Data Analytics
Analytics Big Data Exclusive Software
big data and remote work
Data Helps Speech-Language Pathologists Deliver Better Results
Analytics Big Data Exclusive

Stay Connected

1.2kFollowersLike
33.7kFollowersFollow
222FollowersPin

You Might also Like

Data Mining: Widespread Acceptance When?

1 Min Read

Speeding Past Milestones

3 Min Read

Rexer Data Mining Survey Results

2 Min Read

A Quick Look Back at Partners 2008

5 Min Read

SmartData Collective is one of the largest & trusted community covering technical content about Big Data, BI, Cloud, Analytics, Artificial Intelligence, IoT & more.

AI and chatbots
Chatbots and SEO: How Can Chatbots Improve Your SEO Ranking?
Artificial Intelligence Chatbots Exclusive
ai in ecommerce
Artificial Intelligence for eCommerce: A Closer Look
Artificial Intelligence

Quick Link

  • About
  • Contact
  • Privacy
Follow US
© 2008-25 SmartData Collective. All Rights Reserved.
Go to mobile version
Welcome Back!

Sign in to your account

Username or Email Address
Password

Lost your password?