
Data is growing at a faster pace than ever, thanks to the big data analytics revolution. The amount of global data will reach 40 Zettabytes in just five years, equal to about 8.5 trillion DVDs.
While data is one of the most valuable assets to a company today, it eventually reaches a size too difficult and expensive to manage. Overburdening data can slow application performance, extend system outage windows and make governance/compliance difficult.
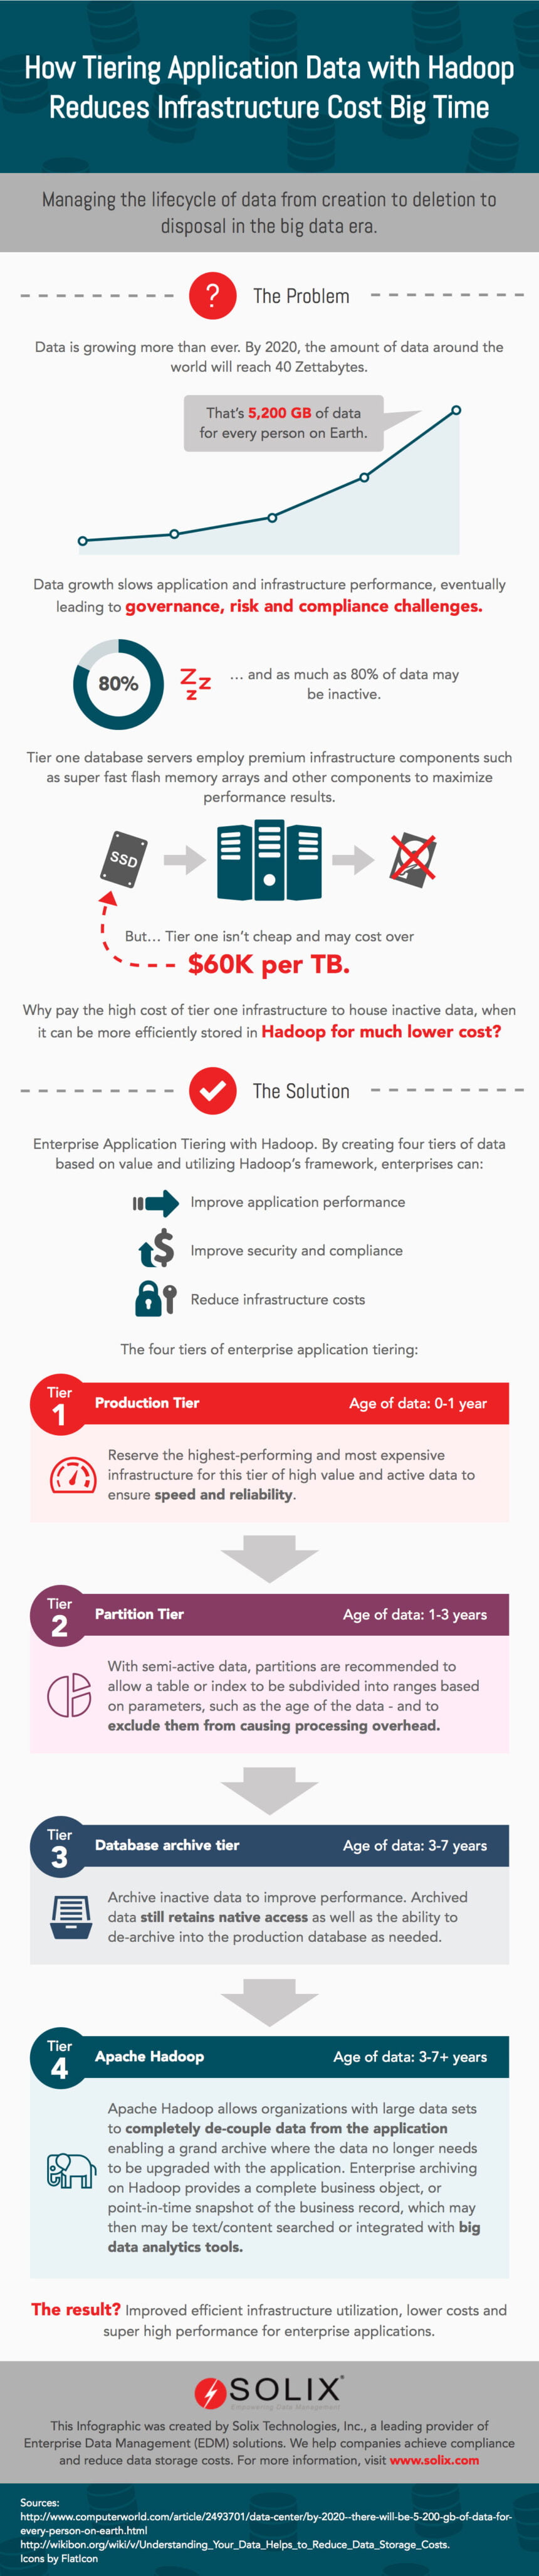
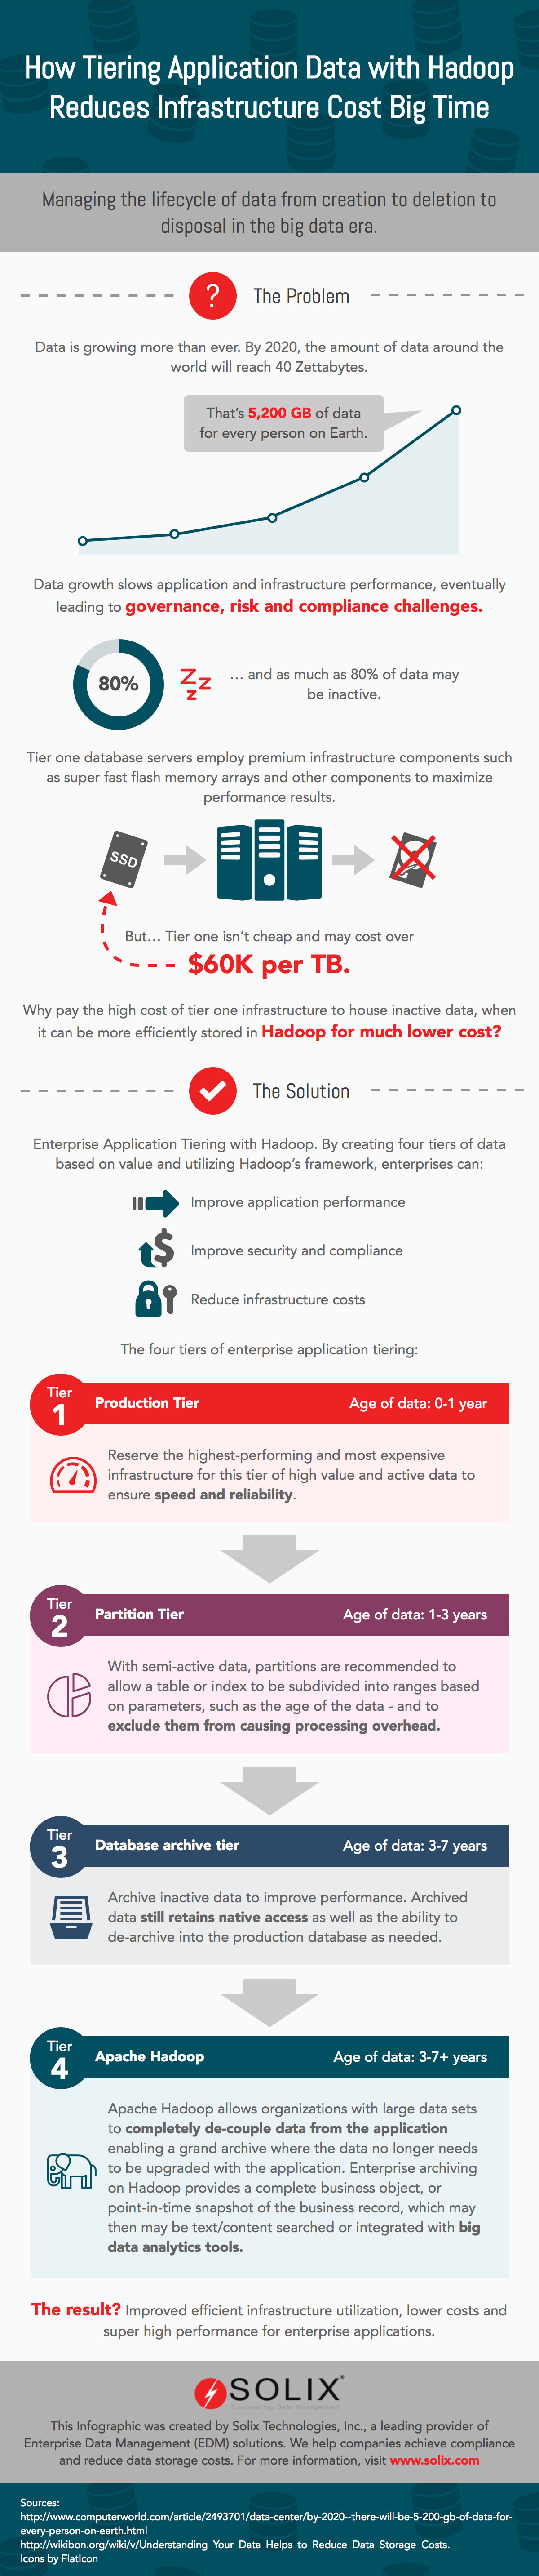
The solution to managing data growth is Application Tiering. Application tiering distributes data among four major tiers based on its age and priority. The four tiers are the Production Tier, Partition Tier, Database Archive Tier and Apache Hadoop Tier.
The Production Tier should contain your highest-performing infrastructure to ensure speed and reliability. Only the most active data should exist in this tier (0-1 year old).
Semi-active data not older than three years should live in the Partition Tier, to avoid causing processing overhead. Partitions allow a table or index to subdivided into ranges based on parameters.
The Database Archive Tier should contain data aged three to seven years. Archived data still retains native access, and can be de-archived into a production database.
Finally, the Apache Hadoop Tier comprises of your largest data sets – decoupled from the application. The Apache Hadoop Tier provides a foundation for big data analytics integration.
With application tiering on Hadoop, companies can improve performance, security, and compliance. Most importantly, it reduces infrastructure costs. Take a look at the infographic below for more information and statistics.


