We use cookies, including third-party cookies from Google to serve personalized ads through AdSense, to operate this site and understand how it is used. By continuing to browse, you accept this use. See our Privacy Policy and Terms of Use for details, including how to opt out of personalized advertising.
Accept
SmartData CollectiveSmartData Collective
  • Analytics
    AnalyticsShow More
    chatgpt image jul 21, 2026, 04 34 30 pm
    4 Core Benefits of Predictive Maintenance after Vibration Analysis
    10 Min Read
    How Does Data Mining Boost Customer Satisfaction in Logistics? Harnessing Analytics for Results -- AI-generated illustration
    How Does Data Mining Boost Customer Satisfaction in Logistics? Harnessing Analytics for Results
    11 Min Read
    chatgpt image jul 13, 2026, 04 23 45 pm
    How Data Analytics Helps Companies Improve User Engagement
    19 Min Read
    chatgpt image jul 13, 2026, 03 59 46 pm
    How Data Analytics Improves Multi-Location Search Strategies
    10 Min Read
    cybersecurity efforts
    How Behavioral Analytics and AI Are Redefining Cybersecurity for Boca Raton Businesses
    14 Min Read
  • Big Data
  • BI
  • Exclusive
  • IT
  • Marketing
  • Software
Search
© 2008-25 SmartData Collective. All Rights Reserved.
Reading: Food+Tech Connect: Promoting a Networked Food System
Share
Notification
Font ResizerAa
SmartData CollectiveSmartData Collective
Font ResizerAa
Search
  • About
  • Help
  • Privacy
Follow US
© 2008-23 SmartData Collective. All Rights Reserved.
SmartData Collective > Uncategorized > Food+Tech Connect: Promoting a Networked Food System
Uncategorized

Food+Tech Connect: Promoting a Networked Food System

JackMason
JackMason
1 Min Read
Food+Tech Connect: Promoting a Networked Food System
Illustrative image generated with OpenAI gpt-image-1.
SHARE

food+tech connect | promoting a networked food system

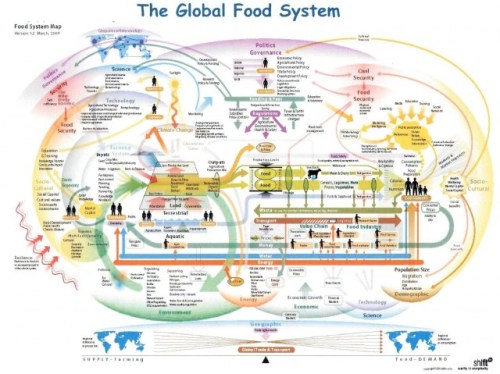
Created by shiftN, this map visualizes the global interconnections among food, agriculture, water, energy, soil, and humans that comprise our food system.

What fascinates me about this map is how I discovered it and how that process demonstrates an opportunity for information technology to connect us with the information, people, and resources necessary to address pressing global food and environmental challenges. I stumbled upon this graphic in a presentation from the Workshop on Skills and Translation of Agri-Food Research in the UK, which I located through a Google search for open agricultural research in the UK. In effect, Google enabled me to quickly and effortlessly discover that the open agriculture conversation is already underway across the ocean.

More Read

July 2009 Early Indications: Love & Work part II
Social Networking, Downtime, Speaking, and Farg
Enhance Your CRM Data to Sharpen Your Sales Pitch
Modeling the MDM Blueprint – Part V
Largest HIPAA Breach Ever: Hackers Steal Data on 4.5 Million Community Health Systems Patients

What about this graphic interests you?

– Danielle Gould

TAGGED:technology
Share This Article
Facebook Pinterest LinkedIn
Share

Follow us on Facebook

Latest News

Illustration of mobile analytics dashboards with ad performance charts connected to backend databases
11 Best Sisense Alternatives for Embedded Analytics
Business Intelligence Exclusive
Analyst points at colorful circular data dashboard on screen - information technology business metrics
How Fragmented Workplace Tech Undermines Reliable Business Metrics and Reporting
Cloud Computing Exclusive Infographic IT
Using Multi-Source Data and Analytics to Detect Operational Drift Across Franchise Networks -- AI-generated illustration
Using Multi-Source Data and Analytics to Detect Operational Drift Across Franchise Networks
Exclusive Infographic
Beyond The First Impression: The Long-Lasting Impact Of Sensory Marketing -- AI-generated illustration
Beyond The First Impression: The Long-Lasting Impact Of Sensory Marketing
Infographic Marketing

Stay Connected

1.2KFollowersLike
33.7KFollowersFollow
222FollowersPin

You Might also Like

e2.0 Iterativ Project Method: Defining business needs and drivers (post 2 or 5)
Uncategorized

e2.0 Iterativ Project Method: Defining business needs and drivers (post 2 or 5)

13 Min Read
IoT Is The Most Important Development Of The 21st Century
ExclusiveInternet of Things

IoT Is The Most Important Development Of The 21st Century

5 Min Read
Business Analytics vs Business Intelligence
Business IntelligenceData Warehousing

Business Analytics vs Business Intelligence

8 Min Read
managed device response
Big DataExclusiveSecurity

Why MDR Is Essential for Big Data Security

22 Min Read

SmartData Collective is one of the largest & trusted community covering technical content about Big Data, BI, Cloud, Analytics, Artificial Intelligence, IoT & more.

ai chatbot
How AI Website Chatbots Improve Customer Support and Lead Generation
Chatbots Exclusive
How To Get An Award Winning Giveaway Bot
Big Data Chatbots Exclusive

Quick Link

  • About
  • Contact
  • Privacy
Follow US
© 2008-26 SmartData Collective. All Rights Reserved.
Welcome Back!

Sign in to your account

Username or Email Address
Password

Lost your password?