As I prepared for a presentation at the Gartner BI conference in Sydney a couple of weeks ago, I thought I’d take a look at old research to how far we’ve come with Analytics in the last few decades.
At first glance, the answers is ‘not very far.’
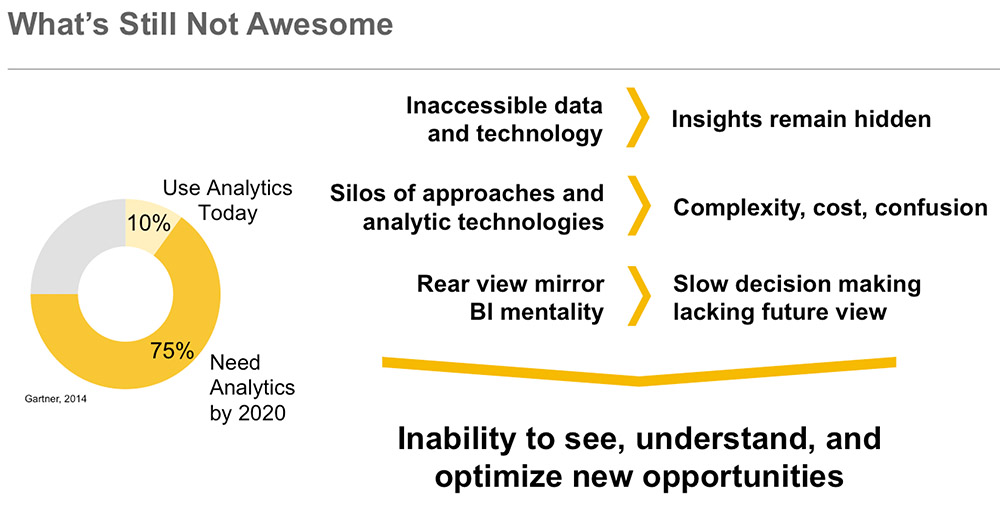
For example, in 1997, only 12% of executives reported basing their decisions on hard facts. By 2014, that had dropped to just 10%.
As I prepared for a presentation at the Gartner BI conference in Sydney a couple of weeks ago, I thought I’d take a look at old research to how far we’ve come with Analytics in the last few decades.

At first glance, the answers is ‘not very far.’
For example, in 1997, only 12% of executives reported basing their decisions on hard facts. By 2014, that had dropped to just 10%.
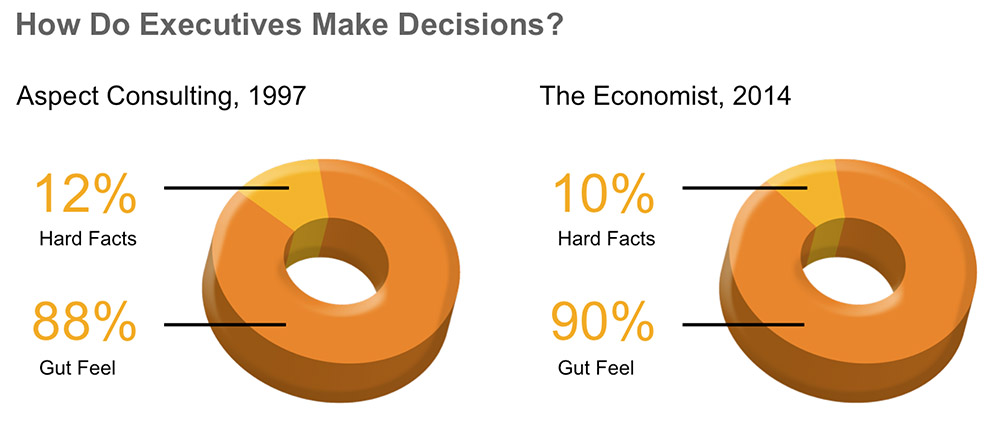
Despite decades of BI investment, executive reliance on gut feel has actually increased.
(Why the worst-practice 3D shaded pie-charts? Just to troll the data viz purists 🙂 ).
A hot topic of Gartner BI research in the late 1990s was the increasingly large ‘fact gap,’ whereby the amount of data available for decisions was rapidly outstripping the available analytic resources.
With some minor modifications, such as changing ‘Terabytes’ to ‘Petabyes’ and ‘Analytic Personnel’ to ‘Data Scientists,’ the picture looks remarkably similar twenty years later.
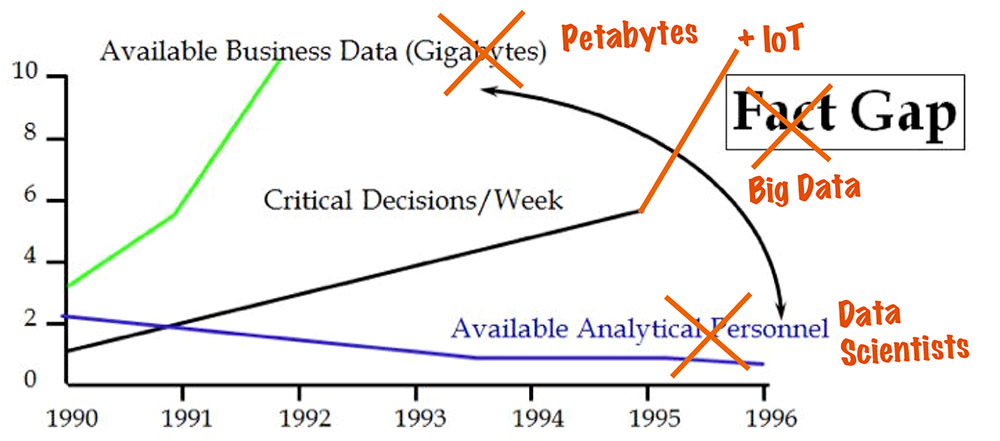
An update to Gartner research from 1996. Plus ça change…
It’s hard to compare perfectly, because of different research methodologies used over the years, but it also seems that the largest factors holding back successful Business Intelligence also haven’t changed very much.
The top three problems remain data quality, ease of use, and the difficulty of integrating different systems.
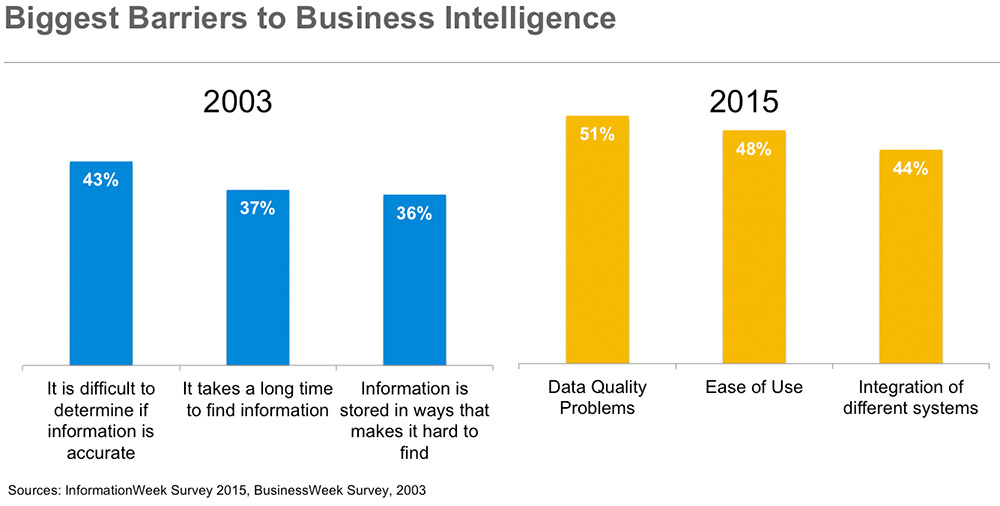
The top three barriers to business intelligence have remained largely unchanged for over a decade
The reality is that today’s technology is much more powerful and widely used than in the past — but what was hard then remains hard today.
What if we could take all of today’s technologies, and start again from scratch? That ended up being the theme of my presentation, and the subject of future posts. In the meantime, please find the presentation below — note that you can download the .pptx version by clicking the right-hand button and going to the slideshare site.