
Today, businesses can benefit greatly from analyzing the data that they receive concerning products, sales, and customers. The value of BI, or business intelligence, comes from being able to sort through this information and identify important connections. Data visualization is a great way to make data discovery clear and digestible. However, some forms of data visualization are better than others. Here are some tips to follow when working with charts to make sure that viewers understand the data.
Don’t Use 3D Unless It’s Absolutely Necessary
Three-dimensional designs are sometimes essential to convey depth and dimension, but when we are talking about charting data, they can add unnecessary confusion. The perspective makes it seem that information marked by the back axis is less important than that in the foreground, which is rarely the case. It’s best to simply avoid these types of charts rather than have to worry about misunderstandings.
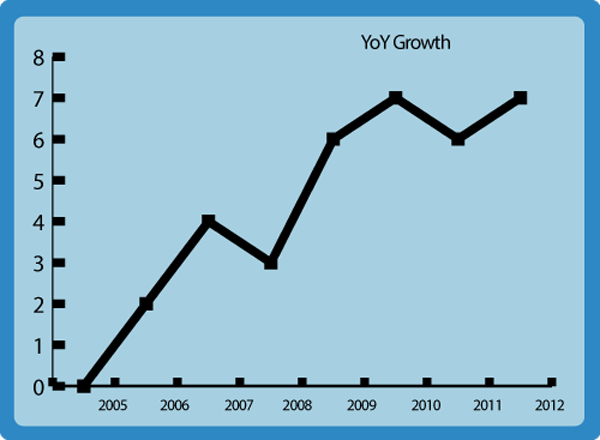
Line Charts Indicate Time Change

When tracking a change over time, always use a line chart to indicate what is being measured. Other types of charts seem disjointed and it will not be immediately clear to other viewers exactly what they are looking at. The connected plots help indicate that the only change is time rather than other variables.
Pie Charts Are Great… If They’re Simple
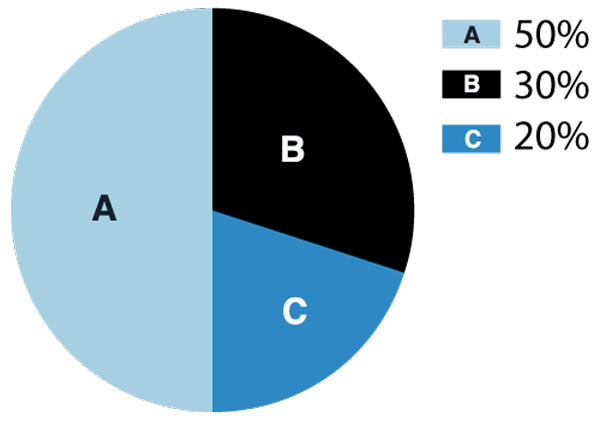
Pie charts can be great for comparing percentages. However, if you’re trying to chart values, a bar graph is a much better option. Keep in mind that pie charts can get convoluted if there are too many sections; a pie chart is most effective when comparing two different values, but if you must include more, make sure that you keep it to five or fewer “slices.” When working with data visualization, the most important thing is that it makes it easier for the viewer to understand. Make sure that your viewer won’t have to work too hard to understand the chart.
Label Directly On Charts
A detached legend that identifies variables can make a chart unnecessarily difficult to read. The eyes have to go back and forth, and the reader must be careful to remember and differentiate between colors. By placing labels directly on the sections they correspond with, you save your reader time and make sure they do not accidentally misinterpret the chart.
Make Sure Colors Stand Out
There is nothing worse than a chart that uses colors that are nearly the same, as this makes the chart difficult to look at and understand. Whenever possible, use as few sections as possible so that you only need to choose a few colors; make sure you pick colors that stand out from each other and will not be confused with one another.
Don’t Forget To Label Axes
It might seem simple, but many people forget to include labels on their axes, especially if they feel they already addressed that in the chart title. It is crucial that people be able to look at your chart and understand it, even without a title.
Utilize The Title Line
A title line can add a lot to a chart, but most people simply identify what is being measured in the title line. By indicating why the chart is important, you can save a lot of time explaining to viewers. A descriptive chart title can both describe what is being measured and why the reader should care.
It’s All About Simplicity
Data visualization makes it easy to understand information so that businesses and individuals can put the data to use. Data discovery often depends on how the information is presented, so it is important to make charts that are as clear as possible.


