We use cookies, including third-party cookies from Google to serve personalized ads through AdSense, to operate this site and understand how it is used. By continuing to browse, you accept this use. See our Privacy Policy and Terms of Use for details, including how to opt out of personalized advertising.
Accept
SmartData CollectiveSmartData Collective
  • Analytics
    AnalyticsShow More
    Flat editorial illustration: The article is about joining public web signals with internal business metrics so BI teams can inter
    Alternative Data in BI: Bringing Public Web Data Into Your Dashboards
    23 Min Read
    Flat editorial illustration: The article is about automating the collection, preparation, and delivery of marketing data across p
    From Data to Dashboards: 5 Marketing Reporting Automation Software Picks
    12 Min Read
    Flat editorial illustration: The article contrasts passive follower totals with a behavioral path from attention and trust to cli
    Creator Analytics Beyond Follower Count: Seven Metrics That Measure Audience Behavior
    11 Min Read
    Flat editorial illustration: The article connects AI and marketing analytics with managerial judgment grounded in consumer behavi
    How an Online MBA in Marketing Connects AI and Data Analytics
    11 Min Read
    What Kind of Problem-Solving Distinguishes Data Analysts From Software Engineers -- AI-generated illustration
    What Kind of Problem-Solving Distinguishes Data Analysts From Software Engineers
    7 Min Read
  • Big Data
  • BI
  • Exclusive
  • IT
  • Marketing
  • Software
Search
© 2008-25 SmartData Collective. All Rights Reserved.
Reading: How are data transformations represented in PMML?
Share
Notification
Font ResizerAa
SmartData CollectiveSmartData Collective
Font ResizerAa
Search
  • About
  • Help
  • Privacy
Follow US
© 2008-23 SmartData Collective. All Rights Reserved.
SmartData Collective > Uncategorized > How are data transformations represented in PMML?
Uncategorized

How are data transformations represented in PMML?

MichaelZeller
MichaelZeller
6 Min Read
How are data transformations represented in PMML?
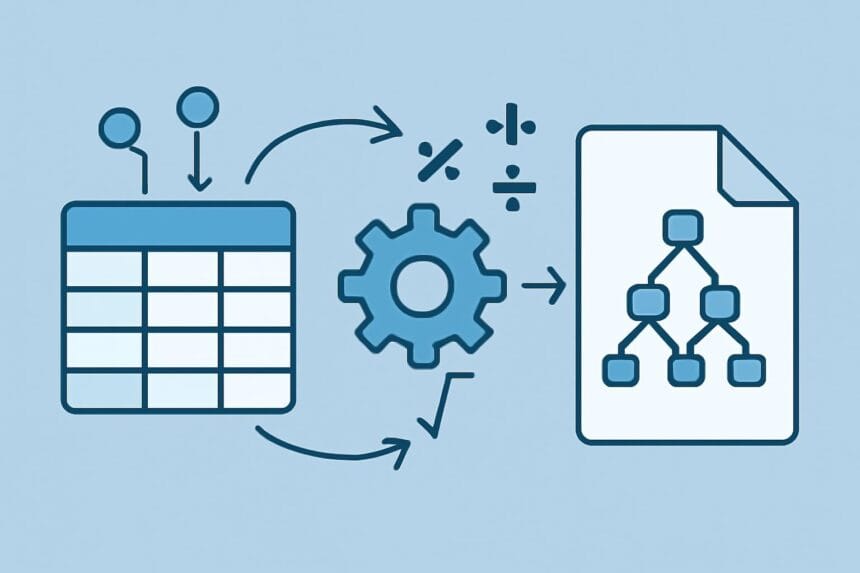
Illustrative image generated with OpenAI gpt-image-1.
SHARE

PMML supports several kinds of data transformations. Below, we list the most common together with examples.

Data transformations involved in the pre-processing of the input variables/fields are mainly located inside the following PMML elements: TransformationDictionary and LocalTransformations.

For the formal PMML schema definition of the transformations covered here, please refer to the PMML Transformations page on the DMG website.

Value Mapping

More Read

Why Would I Ever Tweet?
The Inevitable Wolfram|Alpha Problem: Semantics
Microsoft OneDrive Nixes Unlimited Storage Offerings
3 Cloud Computing Security Holes to Watch Out For
Effective Meetings

Value mapping can be used to map discrete values to discrete values. The example below shows how to map a categorical field (color) into a numerical field (derived_color).


Note that in this example, we are mapping yellow to 3, white to 1, blue to 6, and green to 4.

The original input field named color needs to be defined in the DataDictionary element. The derived field, the result of our data transformation is now called derived_color. This field can subsequently be used by the model as an input variable or used as input for another data transformation.

Discretization

Discretization is used to map continuous values to discrete values. The example below shows how to discretize a continuous field (units) into a discrete field (derived_units).

In this example, we are transforming an interval to a discrete value, more specifically, discretize will transform [1,2[ to 1, [2,3[ to 2, and [3,100] to 3.

The new field is now called derived_units and can be used as input to another transformation or to the model itself.

Normalization

As specified in the DMG website, normalization provides a basic framework for mapping input values to specific value ranges, usually the numeric range [0 .. 1].

NormContinuous

Normalization is used, e.g., in neural networks. In fact, if you export your neural network model using SPSS (starting with version 16), the PMML code generated will contain this kind of transformation for the neural inputs. The R PMML package will also generate a file containing the normalization of input variables for Support Vector Machines (SVMs). The example below was extracted from the Iris_SVM.xml file available in the Zementis website.

The PMML element NormContinuous can be used to implement simple normalization functions such as the z-score transformation (X – m ) / s, where m is the mean value and s is the standard deviation.

NormDiscrete

The NormDiscrete element is used to implement the dummyfication of categorical or ordinal fields. For example, if you have a categorical variable called Marital with the following possible values: Absent, Divorced, Married, Married-spouse-absent, Unmarried, and Widowed, you may want these to be dummyfied (i.e. translated into 0s and 1s) for use by a neural network or SVM. The example below shows the use of element NormDiscrete to accomplish just that.

The set of NormDiscrete instances which refer to input field Marital define a fan-out function which maps a single input field to a set of normalized fields. Note that if Marital is equal to Married, the field derived_MaritalMarried will be assigned a value equals to 1.0 and all other derived_MaritalX fields shown will be assigned values equal to 0.

This code was extrated from the Audit_SVM.xml file available in the Zementis website. It is automatically exported by the R PMML package for SVMs built using the R ksvm (kernlab) package.

Functions

PMML offers several built-in functions, all of which are supported by ADAPA. The list is as follows:

1. +, -, * and /
2. min, max, sum and avg
3. log10, ln, sqrt, abs, exp, pow, threshold, floor, ceil, round
4. uppercase
5. substring
6. trimBlanks
7. formatNumber
8. formatDatetime
9. dateDaysSinceYear
10. dateSecondsSinceYear
11. dateSecondsSinceMidnight

You can find several examples of the use of such functions in the DMG website.

Note that functions such as min, max, sum and avg take a variable number of parameters (derived fields or input fields) and return a single value which you would then assign to a new derived field.

Comprehensive blog featuring topics related to predictive analytics with an emphasis on open standards, Predictive Model Markup Language (PMML), cloud computing, as well as the deployment and integration of predictive models in any business process.

Share This Article
Facebook Pinterest LinkedIn
Share

Follow us on Facebook

Latest News

Flat editorial illustration: The article contrasts tools for gathering fresh interviews with tools for analyzing existing qualita
10 AI Market Research Tools That Turn Qualitative Data into Insights
Artificial Intelligence Big Data Exclusive
Flat editorial illustration: The article compares proxy MCP servers by what an AI agent can do through them: manage proxy account
Proxy MCP Servers: 7 Options and What Each Lets an AI Agent Do
Artificial Intelligence Big Data Data Collection
Flat editorial illustration: The article is about joining public web signals with internal business metrics so BI teams can inter
Alternative Data in BI: Bringing Public Web Data Into Your Dashboards
Big Data Business Intelligence Exclusive Web Analytics
Flat editorial illustration: A SaaS-editorial scene showing product usage, support patterns, and renewal feedback informing a fle
Using Product Usage Analytics and Support Data to Build a B2B Product Roadmap
Business Intelligence Infographic

Stay Connected

1.2KFollowersLike
33.7KFollowersFollow
222FollowersPin

You Might also Like

Why Bad Data Is Wasting Your Marketing Efforts
Uncategorized

Why Bad Data Is Wasting Your Marketing Efforts

8 Min Read
Tracking Could Lead to Awesome Service
Uncategorized

Tracking Could Lead to Awesome Service

5 Min Read
Will 2016 be the Year You Clean up Your Dirty Data?
Uncategorized

Will 2016 be the Year You Clean up Your Dirty Data?

7 Min Read
Google’s Think Quarterly – An Issue for Data Junkies
Uncategorized

Google’s Think Quarterly – An Issue for Data Junkies

5 Min Read

SmartData Collective is one of the largest & trusted community covering technical content about Big Data, BI, Cloud, Analytics, Artificial Intelligence, IoT & more.

Artificial Intelligence for eCommerce: A Closer Look
Artificial Intelligence
ai chatbot
How AI Website Chatbots Improve Customer Support and Lead Generation
Chatbots Exclusive

Quick Link

  • About
  • Contact
  • Privacy
Follow US
© 2008-26 SmartData Collective. All Rights Reserved.
Welcome Back!

Sign in to your account

Username or Email Address
Password

Lost your password?